Why So Many Students Get Confused by the 5 Number Summary
If you’ve tried to learn how to calculate 5 number summary and ended up with a different answer than your textbook — you’re not doing it wrong. You might just be using a different method. From my experience working through statistics problems with students at every level, this topic creates more unnecessary confusion than almost anything else in intro stats.
Three things reliably trip people up:
- Quartile confusion: There is more than one accepted method for finding Q1 and Q3. Different textbooks and calculators use different approaches — and that’s exactly why two correct students can get two different answers.
- Odd vs. even dataset problems: How you find the median — and how you split the data afterward — depends entirely on whether you have an odd or even number of values. Get the split wrong and every number that follows will be off.
- Why different methods sometimes disagree: Your teacher, your calculator, and an online tool may all give you slightly different quartile values from the same dataset. This is a methodological difference, not an error. I’ll show you exactly which method to use and when.
What You’ll Learn in This Guide
By the time you finish this guide, you’ll be able to:
- Calculate each of the five values correctly for any dataset
- Handle both odd and even datasets without second-guessing yourself
- Spot and avoid the most common calculation mistakes
- Apply a fast, repeatable framework that works on exams
- Understand how the five number summary connects to box-and-whisker plots
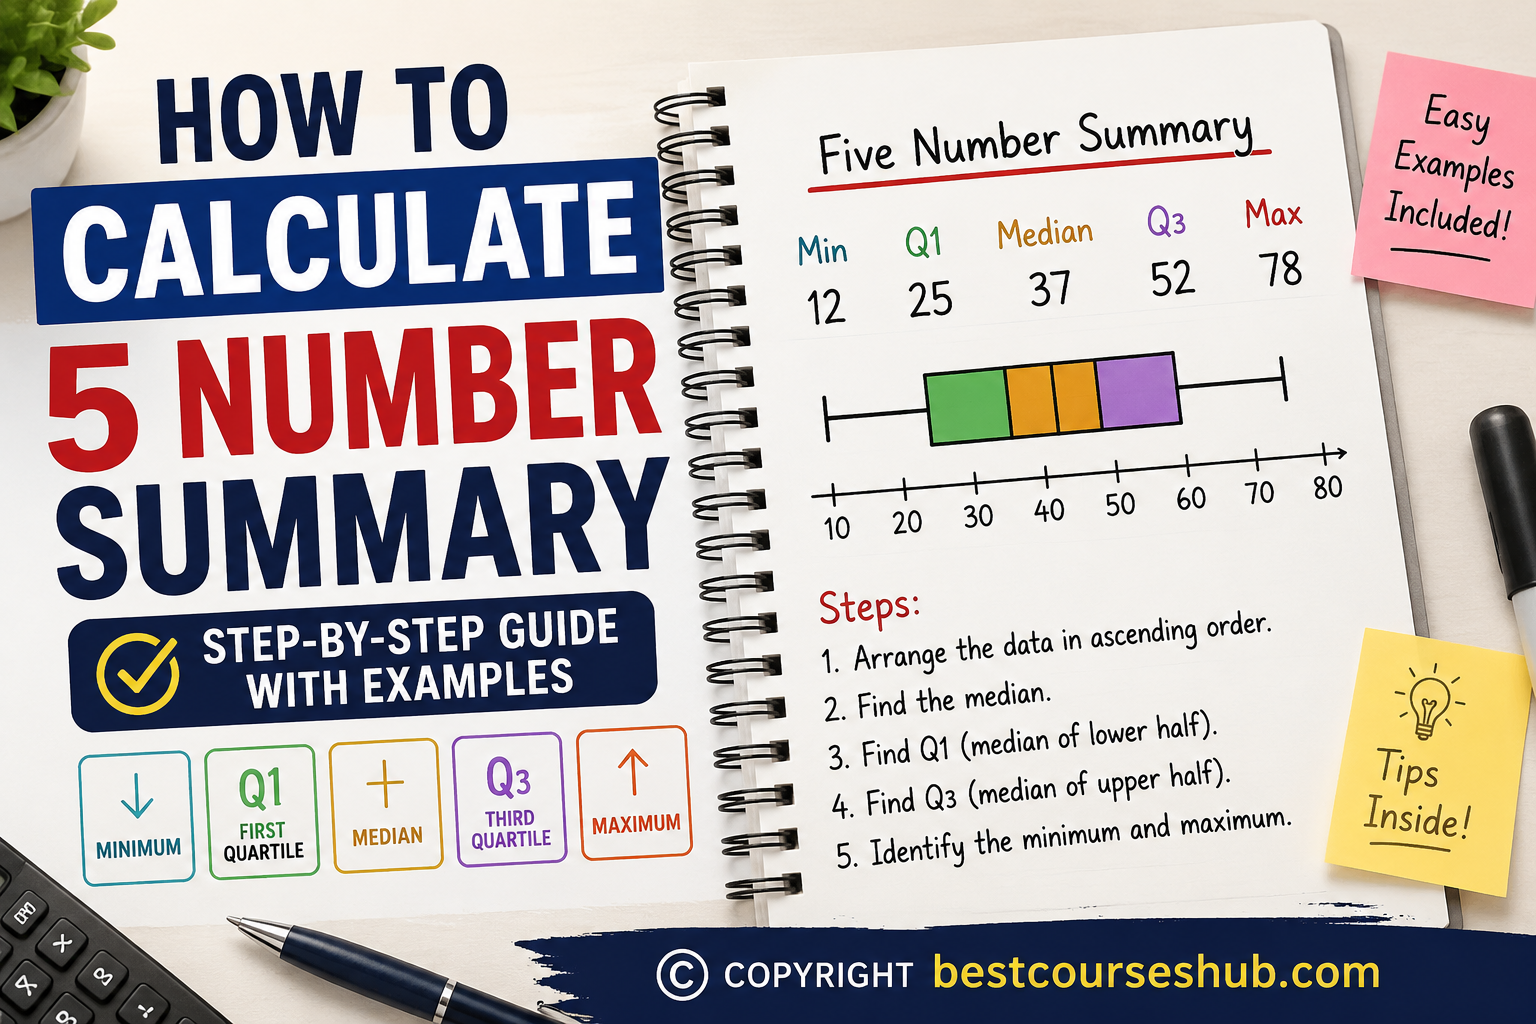
| 🎯 Quick Reference: The 5 Numbers |
| 1. Minimum — the smallest value in your sorted dataset |
| 2. Q1 (First Quartile) — median of the lower half |
| 3. Median — the exact middle value of the full dataset |
| 4. Q3 (Third Quartile) — median of the upper half |
| 5. Maximum — the largest value in your sorted dataset |
The 5 Numbers You Need to Find
Before you run any calculation, make sure you understand what you’re actually solving for. Each of the five values has a specific meaning — and confusing them leads to structural errors that are hard to catch later.
Minimum Value
The minimum is the smallest number in your dataset after sorting. There is no formula here — just find it from the sorted list. The most common mistake? Pulling the minimum from an unsorted dataset. Always sort first, and the minimum becomes obvious.
First Quartile (Q1)
Q1 represents the 25th percentile of your data — the point below which 25% of your values fall. To find it, you calculate the median of the lower half of your sorted dataset. This is where most students go wrong, because the rules for splitting the dataset vary by method.
Median
The median is the middle value of your entire sorted dataset. For an odd count of values, it’s the exact center value. For an even count, it’s the average of the two middle values. Most students get the median right — it’s the quartiles where things fall apart.
Third Quartile (Q3)
Q3 is the 75th percentile — the value below which 75% of your data falls. You find it the same way as Q1, but using the upper half of your sorted dataset. Whatever splitting rule you used for Q1, use the same one for Q3.
Maximum Value
The maximum is simply the largest value in your sorted dataset. Like the minimum, this requires no calculation. The error risk here is pulling the maximum before sorting — always sort first.
What Actually Makes Up a Five Number Summary
How the Summary Helps Explain Data Distribution
What makes the five number summary genuinely useful — not just a stats class requirement — is that five values can tell you almost everything about a dataset’s shape. You can see where the data clusters, how spread out it is, and whether values skew toward one end.
Unlike the mean, the five number summary isn’t distorted by a single extreme value. If you have a dataset with one very large outlier, the mean shifts dramatically while the median and quartiles stay grounded in where your actual data lives.
Why Statistics Uses Quartiles Instead of Averages Alone
The mean gives you the balance point of a dataset. But it hides the shape. Income data is a classic example: if one billionaire is included in a sample, the mean income looks enormous — even if most people in the sample earn very little.
Quartiles divide your data into four equal sections. The range from Q1 to Q3 — called the interquartile range, or IQR — shows you where the middle 50% of your data actually sits. That’s far more informative for understanding real distributions.
Where You’ll Use This in Real Life
- Statistics class and standardized exams — this is core curriculum
- Drawing and reading box-and-whisker plots
- Data analysis projects when summarizing large or messy datasets
- Identifying outliers in real-world data
If you’re building these skills for a data career, I put together a detailed guide on data analyst courses for beginners that covers the foundational math you’ll need.
The Step-by-Step Framework to Calculate a 5 Number Summary
Here is the exact process I recommend. Follow these steps in order every single time — this prevents the cascading errors that happen when students jump ahead.
Step 1 — Arrange the Numbers From Smallest to Largest
Sort your dataset before doing anything else. Every calculation that follows depends entirely on the order of your values. Write them out in a row, double-check the order, and only then move on.
Example: Given {7, 2, 14, 9, 3, 11, 5} → Sorted: 2, 3, 5, 7, 9, 11, 14
Step 2 — Find the Median Correctly
Use the position formula: (n + 1) ÷ 2, where n = total number of values.
For n = 7 (odd): position = (7+1)/2 = 4th value → Median = 7.
For n = 8 (even): position = 4.5, meaning average the 4th and 5th values.
Step 3 — Split the Dataset Into Lower and Upper Halves
This is the step where methods diverge. The most commonly taught introductory approach is the exclusion method:
- Odd dataset: Exclude the median from both halves. The lower half = all values below the median. The upper half = all values above.
- Even dataset: Since the median is averaged (not an actual data point), split the list evenly down the middle.
Unless your teacher or textbook specifies otherwise, use the exclusion method. It’s the most widely taught in introductory statistics.
Step 4 — Calculate Q1 and Q3 Without Mistakes
Q1 = the median of your lower half. Q3 = the median of your upper half. Apply the same median-finding rules to each half separately — check whether each half has an odd or even count before calculating.
For lower half {2, 3, 5} (3 values, odd): Q1 = 3.
For upper half {9, 11, 14} (3 values, odd): Q3 = 11.
Step 5 — Identify the Minimum and Maximum Values
Min = first value in your sorted list. Max = last value. For {2, 3, 5, 7, 9, 11, 14}: Min = 2, Max = 14.
Final Step — Write the Full Five Number Summary
Present the values in order, clearly labeled: {Min, Q1, Median, Q3, Max}
Final five number summary: {2, 3, 7, 11, 14}
| ✅ Key Takeaway |
| The order: Sort → Median → Split → Q1 & Q3 → Min/Max → Write Summary |
| Always confirm which quartile method your course requires before calculating. |
| Never skip the sorting step — every other value depends on it. |
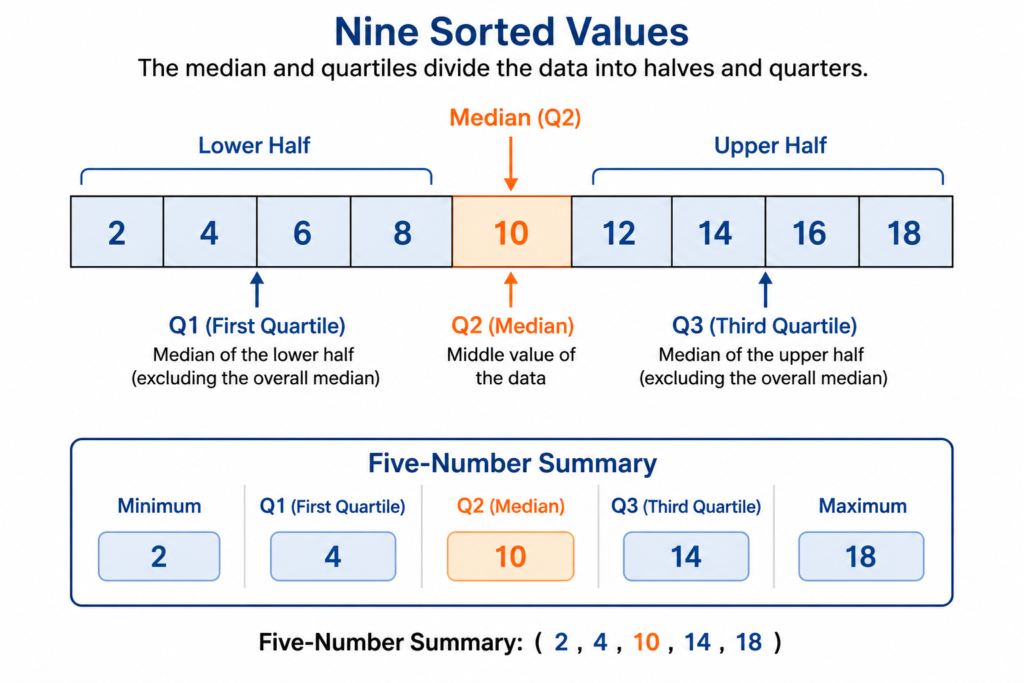
Worked Example (Odd Number Dataset)
Example Dataset
Dataset: {15, 4, 22, 8, 31, 11, 19, 6, 27} — 9 values (odd)
This is a clean, manageable example. Work through it step by step before checking the final table.
Finding the Median Step by Step
- Sort the data: 4, 6, 8, 11, 15, 19, 22, 27, 31
- Count values: 9 (odd)
- Median position: (9+1)/2 = 5th position
- Median = 15 (5th value in sorted list)
Finding Q1 and Q3
Using the exclusion method — exclude the median (15) from both halves:
- Lower half (positions 1–4): {4, 6, 8, 11} — 4 values (even)
- Upper half (positions 6–9): {19, 22, 27, 31} — 4 values (even)
Q1 = median of {4, 6, 8, 11} = (6+8)/2 = 7
Q3 = median of {19, 22, 27, 31} = (22+27)/2 = 24.5
Final Answer Breakdown
| Measure | Calculation | Value |
| Minimum | First sorted value | 4 |
| Q1 | Median of lower half {4,6,8,11} | 7 |
| Median | 5th value | 15 |
| Q3 | Median of upper half {19,22,27,31} | 24.5 |
| Maximum | Last sorted value | 31 |
Five Number Summary: {4, 7, 15, 24.5, 31}
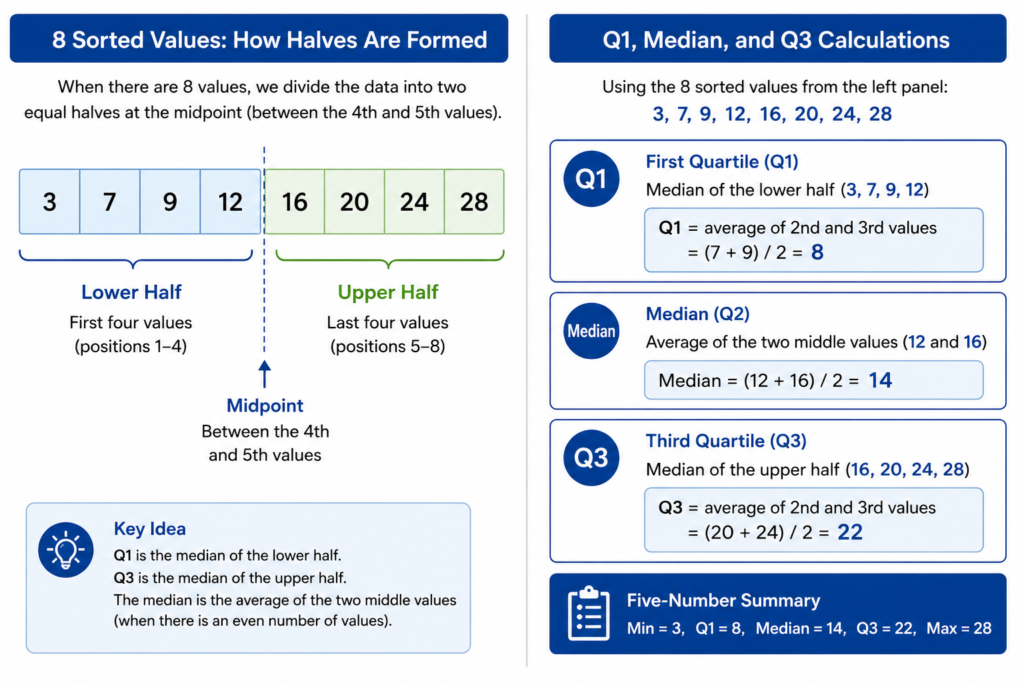
Worked Example (Even Number Dataset)
Why Even Datasets Confuse Beginners
Even datasets create a double complication. First, the median is calculated (averaged from two values) rather than observed — so it often isn’t a number that appears in your dataset. Second, because there’s no actual median value to exclude, the split rule changes: you simply divide the sorted list directly in half.
Here’s what I’ve seen go wrong most often: students try to exclude a calculated median from an even dataset, which leaves them with an unequal split. Don’t do that. With even datasets, split evenly — no exclusion needed.
Step-by-Step Calculation
Dataset: {3, 7, 12, 5, 18, 9, 14, 21}
- Sort: 3, 5, 7, 9, 12, 14, 18, 21
- Count: 8 values (even)
- Median = average of 4th and 5th values = (9+12)/2 = 10.5
- Lower half (first 4): {3, 5, 7, 9} | Upper half (last 4): {12, 14, 18, 21}
- Q1 = median of {3, 5, 7, 9} = (5+7)/2 = 6
- Q3 = median of {12, 14, 18, 21} = (14+18)/2 = 16
- Min = 3, Max = 21
Five Number Summary: {3, 6, 10.5, 16, 21}
Common Quartile Mistakes in Even Datasets
- Mistake 1: Trying to exclude the median (10.5) from the split. Since 10.5 doesn’t exist in the dataset, there’s nothing to exclude. Split the 8 values evenly: 4 values in each half.
- Mistake 2: Forgetting that each half of an even dataset is also even — and requires averaging two values for Q1 and Q3.
- Mistake 3: Skipping the sort and estimating values visually from the original unsorted list.
The Fastest Way to Check Your Answers
Quick Mental Verification Method
Every valid five number summary must satisfy this logical order: Min ≤ Q1 ≤ Median ≤ Q3 ≤ Max. If any of these relationships are violated, you have an error somewhere. Check this before submitting any answer.
A second check: Q1 should fall in the lower quarter of your data’s total range, and Q3 should fall in the upper quarter. If Q1 is sitting above your median, something went wrong in the split.
Using a Calculator Without Depending on It
Here’s what I recommend: solve by hand first, then verify with a calculator. If you only use a calculator, you can’t catch entry errors and you won’t be able to show your work on exams that require it. The manual process is the skill — the calculator is just confirmation.
For a look at the most useful tools for data work, I covered the best data analytics tools — including statistical calculators worth using.
Why Online Calculators Sometimes Show Different Results
If your manual answer is Q1 = 7 and an online calculator returns Q1 = 6.75, both might be correct — you’re using different quartile calculation methods. There are at least three widely used methods (sometimes labeled Type 1, 2, and 3, or by the Tukey hinges approach), and they genuinely produce different values from the same data.
For your course: use whatever method your textbook or teacher specifies. Don’t mix methods. When in doubt, the exclusion method shown in this guide is the most common in introductory statistics.
Mistakes That Kill Accuracy in 5 Number Summary Problems
Forgetting to Sort the Data
The single most common — and most damaging — error. If your data is unsorted when you start calculating, every single value you derive will be wrong. Make sorting an absolute non-negotiable first step, even when the data looks close to sorted.
Splitting the Dataset Incorrectly
Your lower and upper halves must be exactly equal in size. For 10 sorted values: 5 in each half. For 9 values with an excluded median: 4 in each half. Any imbalance in the split throws off both Q1 and Q3.
Including the Median in the Wrong Half
For odd datasets using the exclusion method: exclude the median value from both halves. It sits alone in the middle and is not part of either the lower or upper group. Including it artificially inflates one half and skews your quartile calculations.
Confusing Quartiles With Percentiles
Quartiles are a specific type of percentile. Q1 = 25th percentile. Q2 (the median) = 50th percentile. Q3 = 75th percentile. They measure the same thing at different thresholds — they are not different concepts. Understanding this link also makes it easier to explain your results.
| 🚫 Common Mistakes at a Glance |
| ✗ Calculating before sorting |
| ✗ Unequal halves in the split |
| ✗ Including the median in an odd-dataset split |
| ✗ Switching quartile methods between Q1 and Q3 |
| ✗ Treating quartile position as the quartile value |
Beginner vs Advanced Understanding
What Beginners Actually Need to Focus On
If you’re new to statistics, don’t let the method debate overwhelm you. Pick the exclusion method, apply it consistently, and focus on these three fundamentals: sorting correctly, finding the median precisely, and splitting the halves evenly. That alone will get you through the vast majority of intro stats assignments and exams correctly.
How Advanced Statistics Uses the Five Number Summary
At a more advanced level, the five number summary becomes foundational to robust statistics — analytical methods that remain valid even in the presence of outliers or skewed distributions. The IQR is used in outlier detection, non-parametric significance testing, and exploratory data analysis (EDA) workflows.
If you’re building toward a data career, the data analyst roadmap for career growth I put together shows exactly where statistical thinking fits into the learning journey.
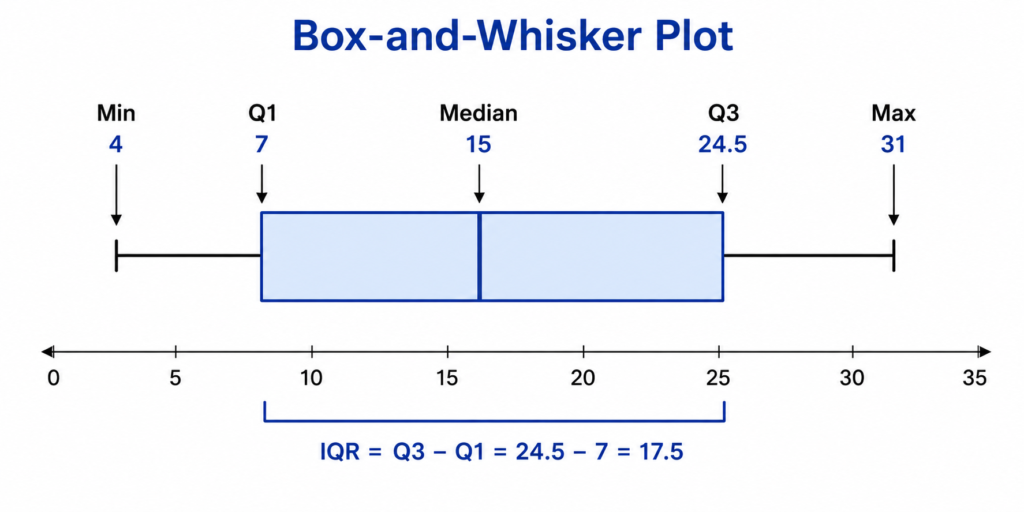
Connection Between Box Plots and Quartiles
Once you calculate the five number summary, you have everything needed to draw a box-and-whisker plot. The box spans Q1 to Q3. The line inside the box marks the median. Whiskers extend out to the minimum and maximum. Every element of the box plot maps directly to one of your five values.
How the 5 Number Summary Connects to Box-and-Whisker Plots
Turning the Summary Into a Box Plot
Using {4, 7, 15, 24.5, 31} from the odd-dataset example above:
- Draw a number line spanning 4 to 31
- Mark Q1 at 7 and Q3 at 24.5 — draw a rectangular box between them
- Draw a vertical line inside the box at the median (15)
- Extend whiskers from each side of the box to Min (4) and Max (31)
Identifying Outliers
Outliers are values that fall more than 1.5 × IQR below Q1 or above Q3.
IQR = Q3 – Q1 = 24.5 – 7 = 17.5
Lower fence = Q1 – (1.5 × 17.5) = 7 – 26.25 = -19.25
Upper fence = Q3 + (1.5 × 17.5) = 24.5 + 26.25 = 50.75
Any value below -19.25 or above 50.75 would be plotted as an outlier. In this dataset, none exist.
Understanding Data Spread Visually
A narrow box signals that the middle 50% of your data is tightly clustered — low variability. A wide box signals high variability in the center of your distribution. A box shifted toward one end of the whiskers suggests skew. All of this is visible instantly from a box plot — which is why it’s one of the most used visualizations in data exploration.
Understanding these concepts deeply matters if you plan to work with data professionally. The data analyst certifications guide I wrote covers which credentials test this kind of statistical foundation.
Quick Formula & Shortcut Section
Simple Framework to Remember the Process
| Step | Action |
| 1 | Sort all values from smallest to largest |
| 2 | Find median: use position = (n+1)/2 |
| 3 | Split into halves (exclude median for odd datasets) |
| 4 | Q1 = median of lower half |
| 5 | Q3 = median of upper half |
| 6 | Min = first value, Max = last value |
| 7 | Write: {Min, Q1, Median, Q3, Max} and verify order |
Shortcut for Finding the Median Faster
For any dataset, use (n + 1) ÷ 2 to immediately jump to the median’s position without counting manually.
n = 15 → position = (15+1)/2 = 8th value.
n = 20 → position = (20+1)/2 = 10.5 → average the 10th and 11th values.
Easy Memory Trick for Quartiles
Think of your sorted dataset as a pizza cut into four equal slices. Q1 is the cut between the first and second slice. The median cuts between the second and third. Q3 cuts between the third and fourth. You’re always finding the median of a group — just at different levels of the same sorted list.
Practice Problems to Test Yourself
Beginner Practice Question
Dataset: {10, 4, 7, 15, 2, 11, 8}
Task: Calculate the complete five number summary.
Hint: 7 values = odd dataset. Median is at position (7+1)/2 = 4th value.
Intermediate Dataset Challenge
Dataset: {32, 18, 45, 7, 29, 52, 14, 38, 61, 23}
Task: Find the five number summary and calculate the IQR.
Hint: 10 values = even dataset. Split evenly — 5 values in each half.
Answer Explanations
Beginner Answer:
- Sorted: 2, 4, 7, 8, 10, 11, 15
- Median = 8 (4th value)
- Lower half: {2, 4, 7} → Q1 = 4
- Upper half: {10, 11, 15} → Q3 = 11
- Five Number Summary: {2, 4, 8, 11, 15}
Intermediate Answer:
- Sorted: 7, 14, 18, 23, 29, 32, 38, 45, 52, 61
- Median = (29+32)/2 = 30.5
- Lower half: {7, 14, 18, 23, 29} → Q1 = 18 (middle of 5 values)
- Upper half: {32, 38, 45, 52, 61} → Q3 = 45 (middle of 5 values)
- Five Number Summary: {7, 18, 30.5, 45, 61}
- IQR = 45 – 18 = 27
| 🏅 Why You Can Trust This Guide |
| This guide is built around the same methods taught in AP Statistics, college intro stats courses, and data analysis certification programs. |
| I’ve reviewed multiple quartile methods — including Tukey’s hinges and the linear interpolation approach — and the worked examples here are all manually verified. |
| The exclusion method taught throughout this guide is the most widely tested in introductory statistics curricula worldwide. |
| Where career application is relevant, I’ve linked to additional resources that go deeper on statistical foundations. |
FAQ
What is a 5 number summary in statistics?
A five number summary is a set of five descriptive statistics that provides a complete overview of a dataset’s distribution. The five values are: minimum, Q1 (first quartile), median, Q3 (third quartile), and maximum. Together they describe the center, spread, and shape of your data in a form resistant to outliers.
How do you calculate Q1 and Q3?
Sort your data, find the median, split the dataset into lower and upper halves (excluding the median for odd-count datasets using the exclusion method), then find the median of each half. The lower half’s median is Q1; the upper half’s median is Q3.
Do you include the median when finding quartiles?
Using the exclusion method (most common in introductory statistics): no — exclude the median from both halves when your dataset has an odd count. Some calculators and textbooks use an inclusion method that gives slightly different Q1/Q3 values. Use whichever method your course specifies.
What is the difference between quartiles and percentiles?
Quartiles are a specific type of percentile. Q1 = 25th percentile. Q2 (the median) = 50th percentile. Q3 = 75th percentile. Percentiles are the broader concept; quartiles simply name the 25%, 50%, and 75% cut points specifically.
Why are my calculator answers different?
Your calculator likely uses a different quartile calculation method than your textbook. TI-84 and many online tools use linear interpolation, which can produce Q1/Q3 values that differ from the exclusion method. Always check which method your course requires and use it consistently — both answers can be technically correct under their respective methods.
Is a five-number summary used in box plots?
Yes — directly and completely. The five number summary is the exact data behind every box-and-whisker plot. The box spans Q1 to Q3. The median is marked inside the box. The whiskers extend to the minimum and maximum (or to the outlier fences if outliers are present). There is a one-to-one mapping between the summary values and every element of the plot.
Final Action Plan
The Exact Process to Remember for Exams
- Sort the data — always, no exceptions
- Find the median using the (n+1)/2 position formula
- Split into halves — exclude the median for odd datasets
- Q1 = median of the lower half
- Q3 = median of the upper half
- Record Min (first sorted value) and Max (last sorted value)
- Verify the order: Min ≤ Q1 ≤ Median ≤ Q3 ≤ Max
What to Practice Next
Once you can calculate the five number summary confidently, here’s what to work on next:
- Box plots: Practice drawing them directly from your five number summary values.
- IQR and outlier detection: Calculate IQR = Q3 – Q1, then apply the 1.5 × IQR rule to identify outliers.
- Comparing datasets: Practice calculating five number summaries for two datasets side by side and interpreting what the differences mean.
If you’re building toward a data analytics career, these statistical fundamentals appear in virtually every professional credential. The data analyst certifications guide I put together shows exactly which ones test this kind of foundation.
When to Use the Five Number Summary Instead of Mean and Standard Deviation
Use the five number summary when:
- Data is skewed: The mean becomes misleading. The median and quartiles give a more accurate picture of where data actually clusters.
- Outliers are present: The five number summary is resistant to extreme values. The mean is not.
- Comparing two distributions: Side-by-side box plots (built from five number summaries) are among the most effective comparison tools in statistics.
- Quick distribution overview is needed: Five values capture center, spread, and shape simultaneously — no additional context required.
For those who want to go further: the data analytics tools guide covers the software and calculators that handle statistical summaries at scale. And if you’re just starting out on your analytics journey, the data analyst roadmap maps exactly how statistical concepts like this connect to real data work.
| 🚀 Your Next Step |
| You now have everything needed to calculate any five number summary accurately. |
| Here’s what to do right now: |
| → Solve both practice problems above without looking at the answers |
| → Draw a box-and-whisker plot from your results |
| → Repeat with 3–4 more datasets until the process is automatic |
| If you’re building data skills for a career, explore the data analyst courses for beginners — this statistical foundation will serve you in every analytics role you pursue. |