Most people who want to become data analysts spend months watching YouTube tutorials, downloading every free course they can find, and still end up stuck — no portfolio, no job, no clear direction. I’ve seen it happen repeatedly, and I understand why: there are too many opinions, too many tools, and not enough honest guidance about what actually matters.
This data analyst roadmap is different. I built it based on what actually gets people hired in 2026 — not what sounds impressive on a curriculum, but what hiring managers look for, what interviewers test, and what separates analysts who land jobs from those who keep learning in circles.
Whether you’re starting from zero or trying to close a skill gap, this roadmap tells you exactly what to learn, when to learn it, and how to prove it matters to employers.
| WHY YOU CAN TRUST THIS GUIDE |
| Built from direct analysis of entry-level and mid-level data analyst job postings in 2026. |
| Incorporates commonly tested SQL, Python, and Excel interview questions from real hiring processes. |
| Learning phases reflect realistic beginner timelines — not theoretical ideals. |
| Every tool recommendation reflects market demand, not personal preference. |
Why Most Beginners Fail to Become Data Analysts
The ‘Learn Everything’ Trap That Wastes Months
From my experience, the number one mistake beginners make is treating the data analyst learning path like a shopping list. They sign up for SQL, pivot to Python, realize they need statistics, then start a Tableau course — and three months later they’ve learned a little of everything and are proficient in nothing.
The ‘learn everything’ trap feels like progress because you’re always consuming content. But consumption isn’t skill. The data analyst roadmap that actually works is built around depth first, breadth second. Master one tool completely before moving to the next. That’s when employers start noticing.
| COMMON MISTAKE |
| Trying to learn Excel, SQL, Python, Power BI, and Tableau simultaneously. |
| Finishing a course but skipping the practice projects at the end. |
| Confusing watching tutorials with being able to perform the task independently. |
What Actually Matters for Getting Hired in 2026
Here’s what I’ve seen consistently across data analyst job descriptions in 2026: employers care far more about SQL fluency and business thinking than the number of courses you’ve completed. A candidate who can write clean queries, explain their logic clearly, and connect data to a business decision will almost always beat someone with four certifications but no portfolio.
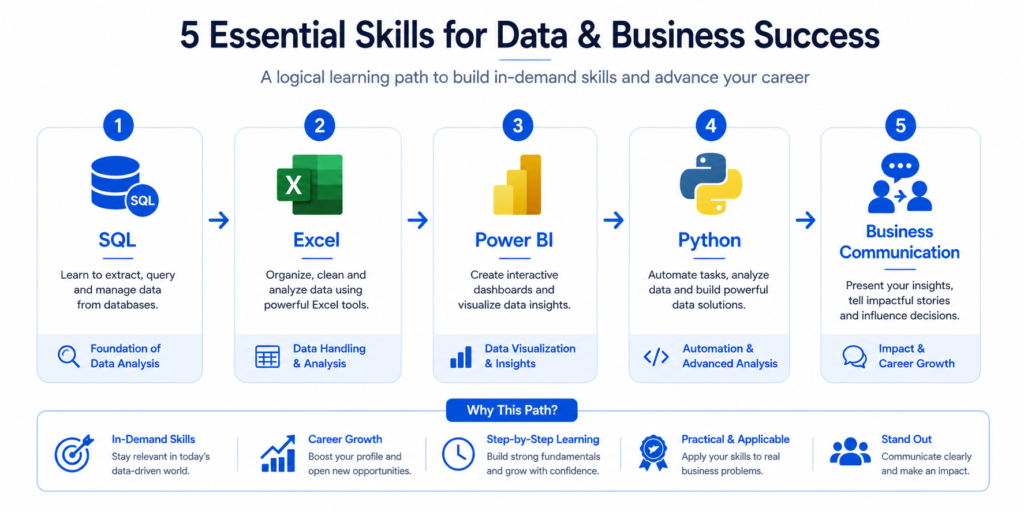
Skills that matter most in order of hiring priority: SQL, Excel/Spreadsheets, data visualization (Power BI or Tableau), communication and storytelling, and basic Python. That’s your core stack — and this roadmap is structured around exactly that sequence.
Who This Roadmap Is For
This data analyst roadmap for beginners is designed for:
- Complete beginners with no prior data or technical experience
- Career changers from marketing, finance, operations, or education
- Students who’ve learned basics but feel lost about what to do next
- Working professionals adding data skills to their current role
If you already have a few years of experience, the later phases — business thinking, portfolio strategy, and career paths — will still give you a useful framework for leveling up.
Quick Answer — What You Really Need to Become a Data Analyst
The Core Skills Employers Expect
| Skill | Why It Matters |
| SQL | Used in virtually every analyst job for querying databases |
| Excel / Google Sheets | Most common tool for reporting and quick analysis |
| Power BI or Tableau | Visual communication of data insights to non-technical stakeholders |
| Basic Python (pandas) | Automation, data cleaning, and advanced analysis tasks |
| Business Communication | Turning numbers into decisions — the most underrated analyst skill |
| Statistics Basics | Understanding distributions, averages, and how to not mislead with data |
The Fastest Learning Order
The fastest path to job-ready follows this exact sequence — the backbone of this entire data analyst roadmap:
- Foundation: business data literacy + statistics basics
- Excel / Google Sheets
- SQL
- Power BI or Tableau
- Python — pandas and matplotlib
- Portfolio projects + GitHub
- Business storytelling skills
- Job applications + interview preparation
The Tools You Should Focus on First
Don’t let tool debates delay you. The correct starting point is Excel, followed immediately by SQL. These two tools alone make you relevant to a very large portion of analyst job listings. Everything else — Power BI, Python, Tableau — builds on the foundation these two create.
How Long It Realistically Takes
A committed beginner spending 2–3 hours daily can become job-ready in 4–6 months. Casual learners spending about 1 hour per day typically take 8–12 months. The difference isn’t intelligence — it’s consistent, deliberate practice with real projects instead of passive tutorial watching.
| KEY TAKEAWAY |
| Job-readiness is about project quality, not course count. |
| 4–6 months is achievable with 2–3 hours of focused daily practice. |
| SQL + Excel proficiency alone qualifies you for many entry-level analyst roles. |
Phase 1 — Build Your Data Foundation First
Learn How Businesses Actually Use Data
Before writing a single formula, you need to understand how businesses think about data. What questions does a company try to answer? What decisions does leadership make every week, and what numbers do they rely on?
Analysts who understand business context before learning tools become far more effective far faster. They know why they’re writing a query, not just how. Start by reading case studies from companies like Airbnb, Spotify, or any e-commerce brand that publishes data blog posts. Understanding the ‘why’ makes every technical skill easier to retain.
Understanding KPIs, Metrics, and Dashboards
KPIs (Key Performance Indicators) are the metrics that tell a business whether it’s moving in the right direction. As a data analyst, you’ll spend significant time building and maintaining dashboards that track these KPIs.
Learn the difference between a vanity metric (something that looks impressive but doesn’t drive decisions) and an actionable metric (something that tells you what to do next). Real business KPIs include monthly active users, customer acquisition cost, churn rate, revenue per user, and conversion rate.
Basic Statistics You’ll Use as a Data Analyst
You don’t need a statistics degree, but you do need a working understanding of:
- Mean, median, and mode — and when each one is more meaningful
- Standard deviation and variance — how spread out your data is
- Correlation vs. causation — the most important concept in all of data analysis
- Distributions — especially normal distribution and skewed data
- Percentiles and quartiles — useful in performance benchmarking
These concepts come up constantly in both job interviews and day-to-day analysis tasks.
Spreadsheet Skills That Still Matter in 2026
Spreadsheets remain the universal language of business data. Even if a company uses SQL or Python internally, the output often ends up in a spreadsheet shared with stakeholders. Build spreadsheet fluency now — it pays dividends throughout your entire career.
Phase 2 — Master Excel Before Anything Else
Excel Skills Most Beginners Skip
Most beginners learn basic SUM and AVERAGE formulas and think they’ve covered Excel. What they skip — and what actually gets tested in interviews — are the more practical workflow skills: data validation, named ranges, conditional formatting for dashboards, and working with large datasets without crashing the file.
Formulas, Pivot Tables, and Lookup Functions That Actually Matter
Here’s what actually works in professional Excel analysis:
- VLOOKUP and XLOOKUP — combining datasets from different sheets
- IF, IFS, and nested IF statements — conditional logic for reporting
- SUMIF, COUNTIF, AVERAGEIF — aggregating data by category
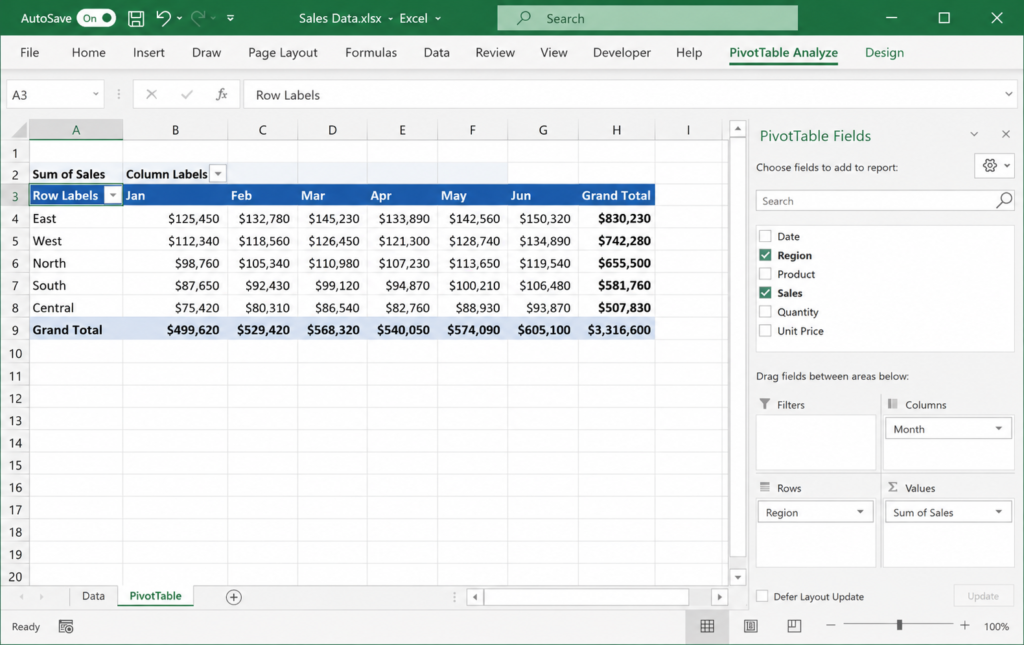
- Pivot Tables — summarizing large datasets in seconds
- INDEX-MATCH — a more flexible alternative to VLOOKUP
- TEXT functions — cleaning messy data: TRIM, LEFT, RIGHT, MID
Real Reporting Tasks You Should Practice
Don’t learn functions in isolation. Build real reporting tasks: a monthly sales summary from raw transaction data, a customer churn tracker, a budget vs. actuals comparison. These small projects train you to think like an analyst, not just an Excel user.
Common Excel Mistakes That Slow Down Learning
| COMMON EXCEL MISTAKES |
| Using merged cells — breaks formulas and pivot tables. |
| Hardcoding values instead of cell references. |
| Not using Tables (Ctrl+T) for structured data — makes formulas auto-expand. |
| Skipping keyboard shortcuts — slows down analysis significantly. |
Phase 3 — Learn SQL the Right Way
Why SQL Is Still the #1 Data Analyst Skill
If I had to pick one skill that defines a data analyst in 2026, it would be SQL — without question. Every company with more than a handful of customers stores data in a relational database, and SQL is the language you use to query it. It’s in almost every analyst job description, tested in almost every technical interview, and directly impacts how fast you can do your job.
The good news: SQL is one of the easier programming languages to learn. Within a few weeks of daily practice, you can write meaningful queries. Within a few months, you can handle complex multi-table analysis.
The Exact SQL Topics Beginners Should Learn First
- SELECT, FROM, WHERE — the foundation of every query
- ORDER BY, LIMIT — controlling output
- GROUP BY with aggregate functions: COUNT, SUM, AVG, MAX, MIN
- JOINS — INNER, LEFT, RIGHT, FULL OUTER
- Subqueries and CTEs (Common Table Expressions)
- Window functions — ROW_NUMBER, RANK, LAG, LEAD
- String and date functions
Learn these in order. Don’t skip ahead to window functions before you’re comfortable with JOINs.
SQL Concepts That Employers Ask in Interviews
What I’ve seen in analyst interview questions repeatedly: the difference between INNER and LEFT JOIN, how GROUP BY works with HAVING, writing a query to find duplicates, using CTEs to simplify complex logic, and calculating running totals with window functions. Practice writing these from memory, not just recognizing them in someone else’s code.
Practice Projects That Build Real SQL Confidence
Use free platforms like Mode Analytics, SQLZoo, or Kaggle datasets in a free PostgreSQL instance. Build projects like:
- Customer segmentation: group users by purchase frequency and value
- Sales performance report: revenue by region, product, and month
- Retention analysis: how many users returned 30 days after first sign-up
- Cohort analysis: tracking user behavior over time by sign-up month
| KEY TAKEAWAY |
| SQL is non-negotiable. Learn it early and practice it every single day. |
| JOINs, GROUP BY, and window functions are the most tested interview topics. |
| Build real analysis projects — not just tutorial exercises. |
Phase 4 — Learn Data Visualization and BI Tools
Power BI vs Tableau — What Actually Matters in 2026
| Feature | Power BI | Tableau |
| Cost | Free Desktop + paid cloud tier | Paid (Tableau Public is free) |
| Job Market Demand | Higher — especially in corporate environments | High — especially in tech and consulting |
| Learning Curve | Moderate — familiar if you know Excel | Steeper — but very powerful |
| Integration | Deep Microsoft 365 integration | Connects to almost any data source |
| Best For | Business reporting, corporate dashboards | Advanced visual analytics |
| Recommendation | Start here in 2026 | Learn after Power BI basics |
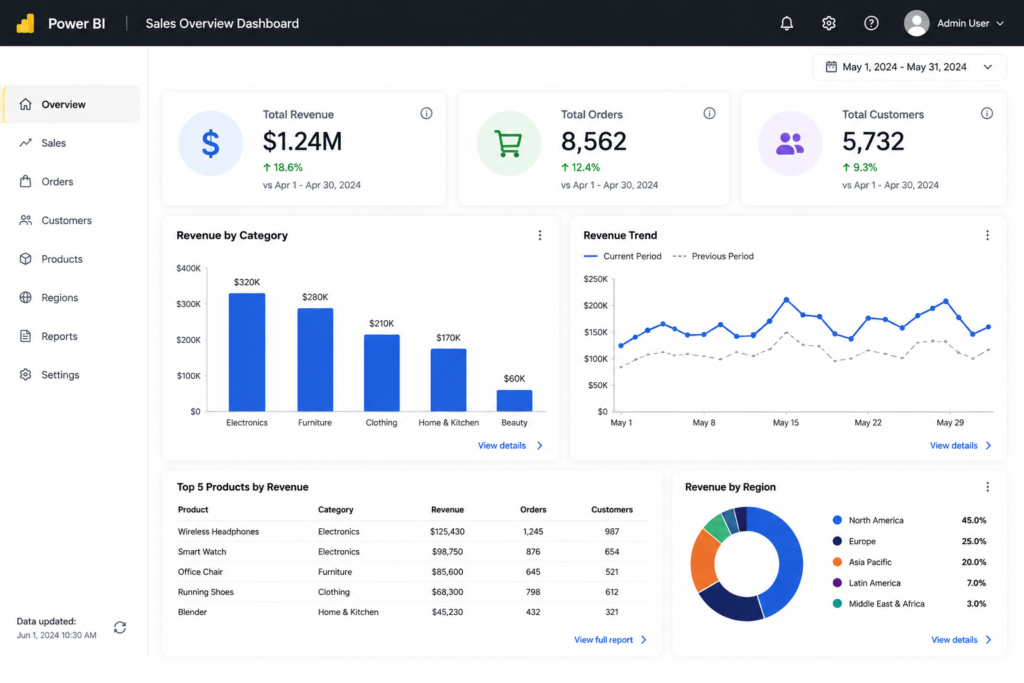
Dashboard Design Principles Beginners Ignore
A dashboard isn’t just charts on a screen. The best dashboards tell a story — guiding the viewer from the big picture to the detail, highlighting anomalies, and making the next action obvious. Most beginner dashboards fail because they show too much data and explain too little.
Design principles that actually make dashboards more effective:
- Use a single primary KPI at the top — make the most important number unmissable
- Group related metrics together — don’t scatter charts randomly
- Use consistent colors — one color family with one accent for alerts
- Label your axes — never make a viewer guess what a number represents
- Add a short text insight — one sentence explaining what the data says
KPI Dashboards You Should Build for Your Portfolio
- E-commerce sales: revenue, orders, average order value, returns by month
- Marketing funnel: impressions, clicks, conversions, cost per lead
- HR dashboard: headcount, attrition rate, hiring pipeline status
- Customer service: ticket volume, resolution time, satisfaction score
Mistakes That Make Dashboards Look Unprofessional
| DASHBOARD MISTAKES |
| Using 3D charts — they distort data perception. |
| Mixing too many chart types without logical reason. |
| No titles or explanations — leaving viewers to guess. |
| Using default color themes without considering accessibility. |
Phase 5 — Start Learning Python Without Overcomplicating It
Do Data Analysts Really Need Python?
Here’s the honest answer: Python is increasingly expected at the mid-to-senior level, but it is not mandatory for your first data analyst job. Many entry-level roles — especially in smaller companies or corporate environments — rely primarily on SQL and Excel. That said, adding basic Python makes you meaningfully more competitive and opens you to better opportunities.
When should Python appear on a data analyst learning roadmap? After SQL is solid. Not before.
The Only Python Libraries Beginners Should Learn
- pandas — for data manipulation and cleaning
- matplotlib and seaborn — for creating charts
- numpy — for numerical operations (often used indirectly through pandas)
That’s it. Don’t add scikit-learn, TensorFlow, or anything else to your beginner list. Those are data science tools. Stay focused on the analyst stack.
Automating Simple Analysis Tasks
The best use of Python early in your analyst career is automation. Merging multiple CSV files, cleaning messy column names, removing duplicates across large datasets, and generating consistent weekly reports — all automatable with a few dozen lines of pandas code. This saves hours every week and demonstrates real technical value.
What Not to Learn Too Early
| WHAT TO AVOID TOO EARLY |
| Machine learning algorithms — not a data analyst requirement. |
| Web scraping — interesting but not core to the analyst role. |
| APIs and full-stack development — save for much later. |
| Deep learning / neural networks — far beyond what most analyst roles require. |
Phase 6 — Build Projects That Make Recruiters Notice You
Why Tutorial Projects Rarely Get Interviews
Following along with a YouTube tutorial is not the same as building a project. When a recruiter sees ten projects on your GitHub that are all copies of the same tutorial dataset with the same analysis, it signals very little about your independent ability. What actually works is projects that start with a question, not a dataset.
Beginner-Friendly Portfolio Project Ideas
- Analyze publicly available sales data to find seasonal trends
- Build a SQL-based report on COVID-19 data from Our World in Data
- Create an Excel tracker for personal finance with automated insights
- Design a Power BI dashboard for a fictional e-commerce company
- Write a Python script that automates a data cleaning workflow
Projects That Demonstrate Business Thinking
The strongest portfolio projects answer a business question. Instead of ‘I analyzed the Titanic dataset,’ say ‘I analyzed passenger data to identify which demographics had the highest survival rates, and how a modern insurance company might use similar segmentation.’ That framing shows business thinking — what separates good analysts from great ones.
How to Present Projects Professionally on GitHub
- Write a clear README explaining the business question, data source, and findings
- Include a screenshot of your dashboard or key chart
- Add comments in your SQL or Python code to explain your logic
- State the tools used and why you chose them
- Summarize the insight in 2–3 plain-language sentences
| PRO TIP |
| Treat your GitHub README like a case study, not a code dump. |
| Recruiters read the README first — make it compelling. |
| One well-documented project is worth more than ten poorly explained ones. |
Phase 7 — Learn Business Thinking and Storytelling
The Difference Between Data Reporting and Data Analysis
Reporting tells you what happened. Analysis tells you why it happened and what to do about it. Most junior analysts spend 90% of their time reporting. The fastest way to accelerate your career is to start doing analysis — not just pulling numbers, but interpreting them and making recommendations.
From my experience, the analysts who advance fastest are those who stop waiting to be asked ‘what does this mean?’ and proactively say ‘here’s what this means, and here’s what I recommend.’
How Great Analysts Explain Insights Clearly
The clearest way to communicate a finding: statement, then evidence, then implication. Tell the stakeholder what you found, show them the data that supports it, then explain what it means for the business. Never lead with charts and expect people to draw their own conclusions.
Questions Analysts Should Always Ask
- What decision will this data inform?
- Who is the audience for this analysis?
- What does ‘success’ look like in this context?
- What would change our conclusion?
- Are there any data quality issues that could affect the result?
Turning Data Into Business Decisions
Great analysis ends with a recommendation. It might be ‘increase the marketing budget in Region 3 because it has the highest return on ad spend’ or ‘stop the promotion in the 18–24 demographic because it generates high volume but low-margin customers.’ Quantify your recommendations wherever possible — that’s what turns a data analyst into a business asset.
The Best Learning Resources for Data Analysts
Best Free Platforms to Learn Data Analytics
| Platform | Best For |
| Khan Academy | Statistics fundamentals and math refreshers |
| W3Schools SQL | SQL basics and quick reference |
| Mode Analytics | SQL practice with real-world datasets |
| Google Looker Studio | Free visualization practice |
| Kaggle | Datasets, notebooks, and competitions |
| SQLZoo | Interactive SQL exercises for all levels |
Courses Worth Paying For
- Google Data Analytics Certificate (Coursera) — solid all-around foundation for beginners
- Alex the Analyst’s Excel, SQL, and Python courses — practical and beginner-friendly
- Analyst Builder by Josh Makador — excellent SQL interview preparation
- DataCamp’s Data Analyst with Python track — good for structured sequential learning
Certifications That Actually Add Value
Certifications help most when they come from recognized sources and signal specific technical competency. In 2026, the ones worth pursuing are:
- Google Data Analytics Certificate — widely recognized, beginner-appropriate
- Microsoft Power BI Data Analyst Associate (PL-300) — strong signal for corporate roles
- AWS Certified Cloud Practitioner — useful if your target company is cloud-heavy
Skip certifications not referenced in actual job postings. A project portfolio consistently beats a certificate collection in real hiring decisions.
YouTube Channels, Blogs, and Communities
- Alex The Analyst (YouTube) — best channel for beginner SQL and Excel
- Luke Barousse (YouTube) — real-world data analyst career content
- Towards Data Science (Medium) — high-quality in-depth analytical articles
- r/dataanalysis (Reddit) — active community for questions and portfolio feedback
- LinkedIn data community — follow practicing analysts to see real work discussions
Beginner vs Advanced Data Analyst Skills
Skills Needed for Entry-Level Roles
| Skill | Expected Level at Entry |
| SQL | Comfortable with JOINs, GROUP BY, subqueries |
| Excel | Pivot tables, VLOOKUP/XLOOKUP, conditional formatting |
| Power BI or Tableau | Can build and publish a basic interactive dashboard |
| Communication | Can explain findings clearly in plain language |
| Python | Helpful but not always required — a bonus at this stage |
Skills That Help You Move Into Senior Roles
- Advanced SQL: window functions, performance optimization, complex CTEs
- Python: automation, data pipeline scripting, statistical modeling
- dbt (data build tool): transforming data inside the data warehouse
- Cloud data platforms: BigQuery, Snowflake, or Redshift
- Stakeholder management: leading analysis projects independently
When to Learn Advanced Analytics
Start learning advanced analytics — statistical modeling, A/B testing, predictive analysis — after at least 12–18 months in an analyst role or after your foundational SQL and visualization skills are completely solid. Rushing into advanced topics before the fundamentals are strong is one of the most common ways people stall their own progress.
Transitioning Into Data Science or Analytics Engineering
After your first analyst role, two natural transitions are data science (if you enjoy predictive modeling and statistics) and analytics engineering (if you enjoy building data pipelines and working with dbt and SQL at scale). Both paths start from a strong data analyst foundation — exactly what this roadmap builds.
Common Mistakes That Kill Progress
Watching Tutorials Without Building Projects
Tutorial paralysis is real. Watching a video gives you the feeling of learning without requiring you to retain or apply anything. After every tutorial or course module, build something — even something small. Open a blank spreadsheet, new SQL editor, or fresh notebook and recreate what you just learned from memory.
Learning Too Many Tools at Once
I’ve spoken with many beginners simultaneously taking a Python course, a Tableau course, and an Excel course. When you do this, you split your attention and never build enough depth in any one tool to use it confidently. Pick one tool, finish your learning goals for it, build a project, then move on.
Ignoring SQL Practice
SQL is not the most exciting skill to practice because there’s no visual reward — it’s just text. But consistently writing SQL, even 20 minutes a day, compounds dramatically over 6 months. Use LeetCode (easy data problems), HackerRank (SQL challenges), or Mode Analytics. Treat it like a daily workout, not a weekly event.
Building Dashboards Without Business Context
A dashboard showing 12 charts about nothing in particular tells a recruiter very little. Every dashboard in your portfolio needs a business context: what company (real or fictional) is this for, what question are you answering, and what should the viewer do with this information?
Applying for Jobs Too Late
Beginners wait until they feel 100% ready — and that moment never comes. A better strategy: start applying when you’re about 70% ready. Real job applications teach you faster than any course. You’ll learn exactly which skills are missing from your profile through interview feedback, not through guessing.
| PRO TIP |
| Start applying when you have basic SQL, one dashboard in your portfolio, and a clean GitHub profile. |
| You don’t need to check every box on a job description to apply. |
| Interview rejection is the most targeted learning feedback you can get. |
A Realistic 6-Month Data Analyst Learning Roadmap
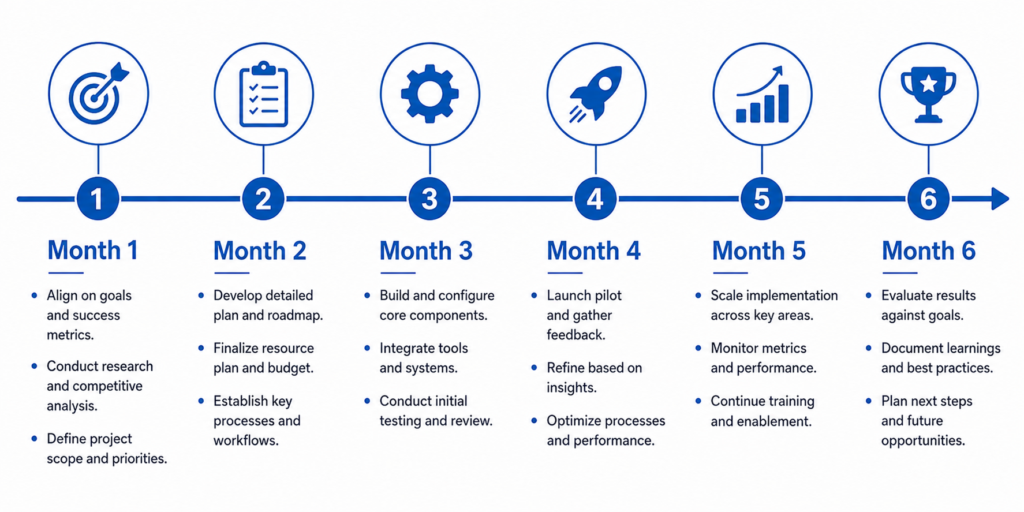
Month 1–2 Learning Priorities
Month 1: Data foundations, business KPIs, and Excel. Focus on becoming fully comfortable with pivot tables, VLOOKUP/XLOOKUP, and key formulas. Build two small Excel reporting projects.
Month 2: Begin SQL. Work through SELECT, WHERE, GROUP BY, and JOINs. Complete at least 30 SQL exercises on SQLZoo or HackerRank. By end of Month 2, you should be writing multi-table JOIN queries with confidence.
Month 3–4 Skill Building Plan
Month 3: Advance your SQL into subqueries, CTEs, and window functions. Start your first Power BI or Tableau course. Build your first basic dashboard using a free dataset — the Superstore sample data is a great starting point.
Month 4: Build one complete portfolio project combining SQL analysis with a Power BI dashboard. This becomes your anchor portfolio piece. Start basic Python: data loading, cleaning, and simple analysis with pandas.
Month 5 Portfolio + Resume Strategy
Month 5: Polish your portfolio. Build one more project with a clear business context. Write a compelling GitHub README for each project. Update your LinkedIn profile to reflect your new skills. Create a one-page resume focused on skills and projects, not just education history.
Month 6 Interview Preparation Framework
Month 6: Practice SQL interview questions daily — start with LeetCode Easy, move to Medium. Study common analyst interview scenarios: how to approach an unfamiliar dataset, how to explain a drop in a key metric, how to professionally disagree with a stakeholder’s interpretation. Do mock interviews and start applying actively.
| KEY TAKEAWAY |
| Month 1–2: Excel + SQL fundamentals. |
| Month 3–4: Power BI dashboard + Python basics. |
| Month 5: Portfolio polish + resume. |
| Month 6: Interview prep + active applications. |
Tools Every Data Analyst Should Know in 2026
| Tool | Role in Analytics Workflow |
| Excel | Everyday reporting, quick analysis, stakeholder-facing deliverables |
| SQL | Querying databases, data extraction, ad hoc analysis |
| Power BI | Interactive dashboards and business performance reports |
| Tableau | Advanced visual analytics and data storytelling |
| Python (pandas) | Data cleaning, automation, larger-scale analysis |
| Google Sheets | Collaborative analysis, lightweight reporting |
| GitHub | Portfolio hosting, version control, demonstrating code quality |
Excel
Excel remains one of the most universally expected tools in a data analyst’s toolkit. Even if your company uses SQL or Python internally, stakeholders often want deliverables in Excel. Master it early and revisit it often.
SQL
SQL is the lingua franca of data. Every relational database — MySQL, PostgreSQL, SQL Server, BigQuery, Snowflake — uses SQL. The syntax differs slightly across platforms, but the core concepts transfer completely.
Power BI
Power BI is the dominant BI tool in enterprise environments, particularly those using Microsoft 365. Its integration with Excel, Teams, and SharePoint makes it especially practical in corporate settings.
Tableau
Tableau excels in tech companies, consulting firms, and organizations with complex visualization needs. Tableau Public lets you build and publish dashboards for free — ideal for portfolio work.
Python
Python’s role in data analytics continues to grow. pandas for data manipulation and matplotlib/seaborn for visualization are the core analyst tools. Add these after SQL is solid.
Google Sheets
Google Sheets is increasingly used for collaborative work, especially in startups and remote teams. Most Excel formulas work in Sheets, making this a low-effort addition to your skill set.
GitHub
GitHub is your professional portfolio as a data analyst. Every project should be version-controlled and published with a clear README. Recruiters check GitHub — make sure yours tells a coherent story about your capabilities.
Data Analyst Career Paths After Your First Job
| Career Path | What It Involves |
| Business Intelligence Analyst | Building and maintaining enterprise dashboards and reporting systems |
| Product Analyst | Analyzing user behavior to inform product decisions — heavy on A/B testing and funnel analysis |
| Analytics Engineer | Building data pipelines using dbt and SQL — technical and infrastructure-focused |
| Data Scientist | Statistical modeling, machine learning, and predictive analytics |
| Marketing Analyst | Attribution modeling, campaign analysis, customer segmentation |
| Financial Analyst | Forecasting, budgeting, variance analysis, and financial reporting |
Business Intelligence Analyst
BI analysts build scalable reporting infrastructure. If you enjoy dashboard design, data modeling, and working with multiple stakeholders to define metrics, this is a natural evolution from a general analyst role.
Product Analyst
Product analysts sit at the intersection of data and product development. You’ll run A/B tests, analyze feature adoption, and answer questions like ‘did this new feature improve user retention?’ Strong SQL and statistical thinking are essential.
Analytics Engineer
Analytics engineering is one of the fastest-growing data roles. You’ll use tools like dbt to build clean, reliable data models that the entire analytics team depends on. Think of it as the bridge between data engineering and data analysis.
Data Scientist
Data scientists build predictive models, work with machine learning algorithms, and tackle more complex statistical problems. Transitioning here typically requires additional learning in Python, scikit-learn, and probability theory.
Marketing Analyst
Marketing analysts measure campaign effectiveness, model customer lifetime value, and help marketing teams spend smarter. Strong SQL, Excel, and familiarity with tools like Google Analytics are core requirements.
Financial Analyst
Financial analysts do forecasting, variance analysis, and financial modeling. Excel and SQL are essential. Many financial analyst roles at tech companies also expect Power BI or Tableau for executive-facing dashboards.
Frequently Asked Questions
Can I Become a Data Analyst Without a Degree?
Yes — and many working data analysts don’t have a degree in data science, statistics, or computer science. What matters more in 2026 is a strong portfolio, demonstrable SQL and Excel skills, and the ability to communicate insights clearly. A degree helps, but it’s far from the deciding factor in most hiring decisions.
Is Python Mandatory for Data Analysts?
Python is not mandatory for entry-level data analyst roles, though it’s increasingly expected. Many companies hire analysts who know SQL, Excel, and a BI tool without requiring Python. That said, adding basic Python — especially pandas — makes you significantly more competitive and opens better opportunities over time.
How Long Does It Take to Become Job-Ready?
A motivated beginner spending 2–3 hours daily can realistically become job-ready in 4–6 months. Casual learners spending about 1 hour per day typically take 8–12 months. The timeline depends heavily on project consistency, not just course completion rates.
Which Is Better — Power BI or Tableau?
Both are excellent tools, but in 2026 I recommend starting with Power BI. It has more job listings in corporate environments, lower cost, and a gentler learning curve — particularly if you already know Excel. Learn Tableau as a secondary tool once you’re comfortable with Power BI fundamentals.
Do I Need Certifications to Get Hired?
Certifications can signal credibility to hiring managers, especially when you don’t have a formal background. The Google Data Analytics Certificate and Microsoft PL-300 (Power BI) are the most recognized. However, a portfolio with real, business-focused projects will consistently outweigh a list of certificates in real hiring decisions.
Can I Become a Data Analyst Without Coding?
For many entry-level analyst roles, you can get by with minimal to no traditional coding. SQL is technically a query language rather than a full programming language, and Excel requires none. However, learning basic Python will significantly broaden your opportunities over time.
Final Action Plan — What to Do Next
The Exact First 30 Days You Should Follow
- Week 1: Learn business data basics. Read two case studies on how real companies use data. Understand KPIs, metrics, and dashboards. Watch a 1-hour intro to data analysis.
- Week 2: Begin Excel. Focus on pivot tables, VLOOKUP/XLOOKUP, SUMIF, and COUNTIF. Complete 5 real reporting exercises.
- Week 3: Begin SQL. Complete W3Schools SQL basics and start SQLZoo interactive exercises. Write 15 practice queries by end of week.
- Week 4: Build your first combined project — pull data in Excel, write 3–5 SQL queries on a dataset, create a simple summary dashboard. Document it on GitHub.
Your First Portfolio Project Strategy
Your first portfolio project should be simple, documented well, and business-focused. Choose a free dataset from Kaggle or a government open data portal. Define a business question to answer. Analyze the data using SQL or Excel. Present your findings in a short dashboard or slide. Write it up as a case study on GitHub.
| PRO TIP |
| Your first project doesn’t need to be impressive — it needs to be real. |
| Document every step so recruiters can see how you think. |
| Choose a dataset related to an industry you want to work in. |
How to Start Applying Without Feeling ‘Ready’
Here’s what actually works: start applying when you have one portfolio project, basic SQL skills, and a clean LinkedIn profile. You will get rejected — that’s the system working correctly. Each rejection teaches you more about your specific skill gaps than any self-assessment can. Apply to 3–5 roles per week while continuing to learn.
The Mindset That Helps Beginners Succeed Faster
The data analyst roadmap is a guide, not a guarantee. What separates people who get hired in 6 months from those still ‘almost ready’ after 18 months is almost never intelligence or talent. It’s consistency, project output, and willingness to put imperfect work in front of real people early.
Build things that aren’t perfect. Apply before you feel ready. Ask for feedback publicly. These habits compound into a career faster than any course sequence ever can.
| YOUR NEXT STEPS — START TODAY |
| 1. Pick ONE tool to start with today: Excel if brand new, SQL if you have basic spreadsheet skills. |
| 2. Set a daily learning block of at least 60–90 minutes and protect it. |
| 3. Create a GitHub account and a LinkedIn profile if you haven’t already. |
| 4. Start building your first project in Month 1 — don’t wait until you feel ready. |
| 5. Return to this data analyst roadmap monthly to track your progress against the 6-month timeline. |
| 6. Apply when you’re 70% ready. Rejection teaches faster than any course. |