Why Business Intelligence Development Is One of the Most Valuable Data Careers Today
If you’ve ever stared at a jumbled spreadsheet, wishing someone could turn all that raw data into something that actually makes sense — that person is a business intelligence developer. And right now, companies are paying very well to find them.
I’ve spent years working around data teams and watching organizations struggle to make decisions without proper reporting infrastructure. The ones that invested in solid BI development made better decisions faster. The ones that didn’t? They were always guessing.
The business intelligence developer role sits at a rare intersection: technical enough to build data pipelines, analytical enough to model data, and business-smart enough to turn numbers into dashboards executives actually use. That combination is genuinely hard to find — which is exactly why it pays so well.
The Growing Demand for BI Developers
The global business intelligence market is projected to surpass $33 billion by 2025, and it’s still climbing. Organizations across every industry — retail, healthcare, finance, logistics — are sitting on mountains of data they don’t know how to use. BI developers are the ones who unlock that value.
From my experience, the demand isn’t just growing — it’s shifting. Companies no longer just want someone who can pull a SQL query. They want business intelligence developers who understand the full data lifecycle: ingestion, modeling, transformation, visualization, and storytelling.
Why Companies Need Better Reporting and Analytics
Here’s what I’ve seen happen repeatedly: a company implements a CRM, an ERP, and three SaaS tools — and then nobody can answer a simple question like ‘Which product line is actually profitable?’ The data exists, but it’s siloed, inconsistent, and impossible to query without proper BI infrastructure.
Business intelligence developers build the bridges between raw operational data and actionable insights. They create the reporting systems that help marketing teams optimize campaigns, operations teams cut waste, and executives make calls backed by evidence rather than gut feeling.
How AI Is Changing Business Intelligence Roles
Let me be direct: AI is not replacing BI developers. It’s changing what they do. Tools like Microsoft Copilot for Power BI and Looker’s AI integration are automating the repetitive parts — like basic chart creation or summary writing. What they can’t replace is the data modeling logic, business context awareness, and the judgment required to build a reporting system that actually works.
The BI developers thriving in 2026 are the ones who’ve learned to use AI as a productivity multiplier, not a threat. If you understand the fundamentals — SQL, data modeling, ETL — AI tools make you faster, not obsolete.

Quick Answer: What Does a Business Intelligence Developer Actually Do?
A business intelligence developer designs, builds, and maintains the data infrastructure that turns raw information into business insights. They work across the full BI stack — from writing SQL queries and building data models, to creating dashboards in Power BI or Tableau, to connecting cloud data warehouses.
Core Responsibilities in Modern BI Teams
- Design and maintain data warehouses and data marts
- Write complex SQL queries and stored procedures
- Build and publish dashboards and reports in Power BI, Tableau, or Looker
- Develop and manage ETL/ELT pipelines
- Create and document data models (star schema, snowflake schema)
- Collaborate with business stakeholders to understand reporting needs
- Monitor data quality and resolve pipeline failures
- Optimize slow-running queries and report performance
Reporting, Dashboards, and Data Modeling Explained
These three terms get thrown around interchangeably, but they’re different layers of the same stack. Reporting is delivering structured outputs — weekly sales reports, monthly financial summaries. Dashboards are interactive visual tools that let users explore data themselves. Data modeling is the foundation underneath both: designing how data is structured so it can be queried efficiently and accurately.
Most beginners focus entirely on dashboards because they’re visual and impressive. What actually separates good BI developers from great ones is their data modeling skills. A beautiful dashboard built on a poorly modeled dataset is just a fast path to wrong answers.
Where BI Developers Fit in the Data Ecosystem
Think of the data ecosystem as a pipeline: data engineers build the pipes (ingestion, storage), BI developers build the refineries (modeling, transformation, reporting), and data analysts use the outputs to answer business questions. BI developers sit in the middle — they need to understand engineering concepts AND business context, which is what makes the role so valuable.
| 🔑 Key Takeaways |
| BI developers build the systems that turn raw data into business decisions |
| Data modeling skills matter more than dashboard aesthetics |
| AI is changing BI workflows — but not replacing the role |
| BI developers collaborate across engineering, analytics, and business teams |
Who This Career Path Is Best For
From what I’ve seen, the business intelligence developer path attracts a surprisingly diverse group of people. Here’s an honest breakdown of who tends to succeed — and why.
Beginners Entering Tech
If you’re starting from scratch, BI development is one of the most accessible data careers. SQL is learnable in weeks, not months. Power BI has a relatively gentle learning curve. And unlike software engineering, you don’t need to master algorithms or system design to land your first role. What you do need is patience with messy data and curiosity about how businesses actually work.
Data Analysts Transitioning Into BI
This is the most natural transition I’ve seen. If you already work with data in Excel or basic SQL, you’re closer than you think. The jump involves learning data modeling properly, understanding ETL concepts, and gaining hands-on experience with a BI platform like Power BI or Tableau at a level beyond basic charts.
If you’re currently in data analysis and want to level up your skills, check out this guide on data analyst courses for beginners — it covers the foundational skills that feed directly into BI development.
Excel Users Moving Toward Modern Analytics
Excel power users have a genuine advantage: they already think analytically. The mental shift is moving from cell-by-cell logic to set-based thinking (SQL), from manual calculations to automated pipelines, and from flat files to relational databases. It’s a real shift, but Excel experience makes it faster.
Developers Interested in Data Products
If you have a software development background, you’ll find ETL development and data pipeline work extremely familiar. Your challenge will be learning the business context — understanding why a CFO needs a particular KPI formatted a specific way — more than the technical side.
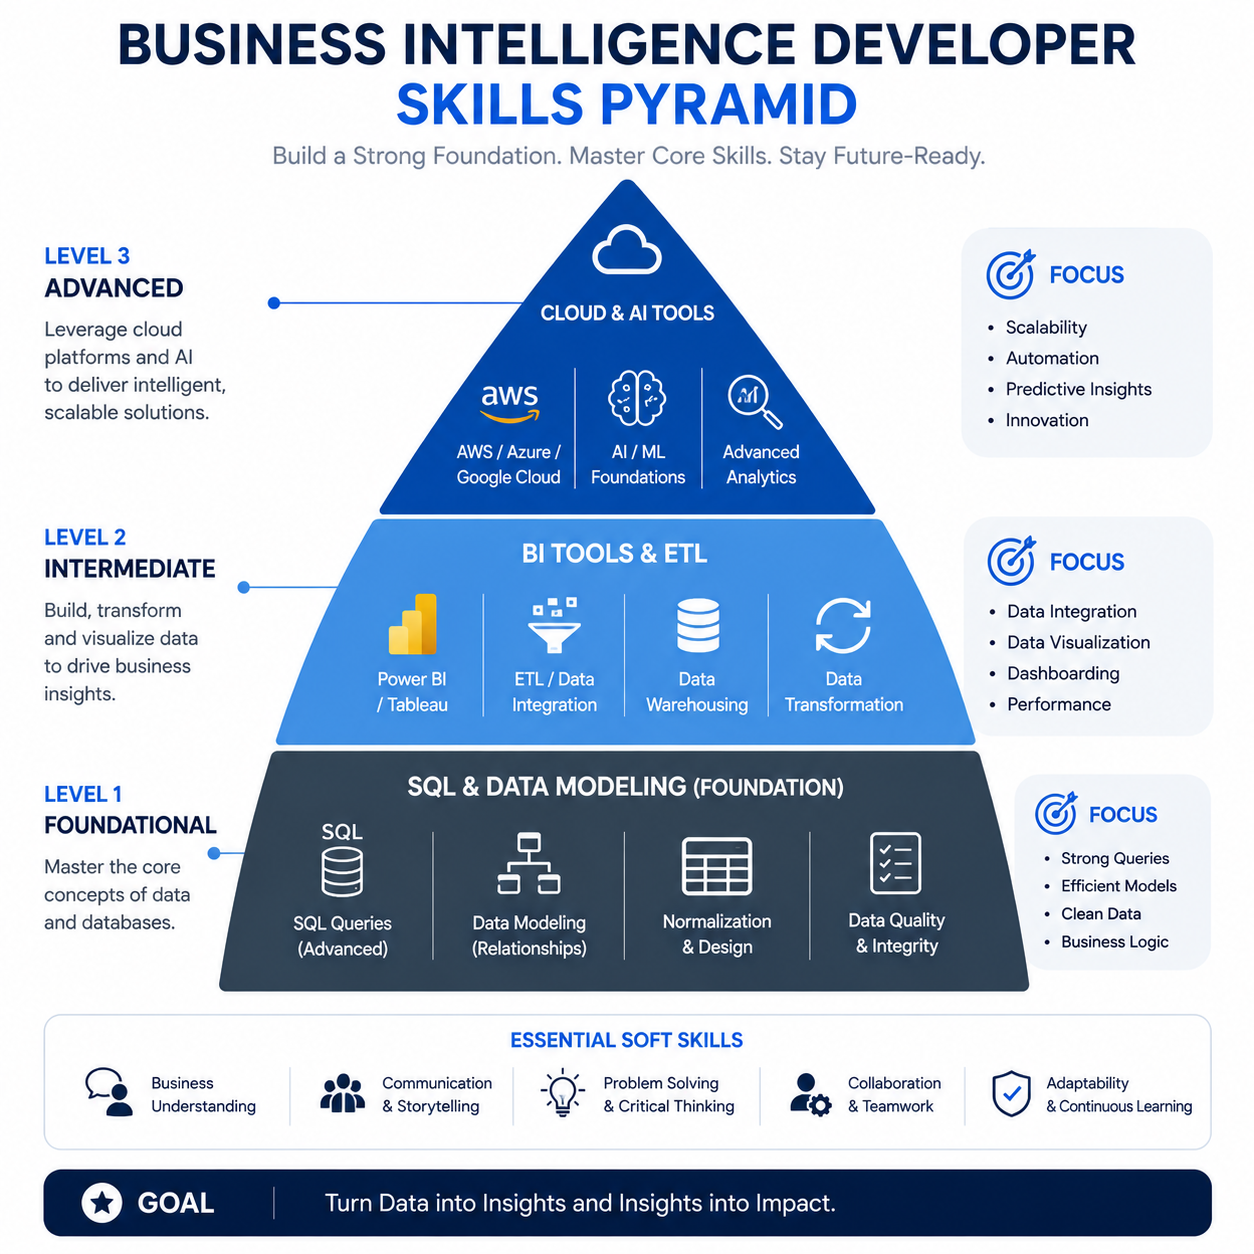
The Skills That Actually Matter for Business Intelligence Developers in 2026
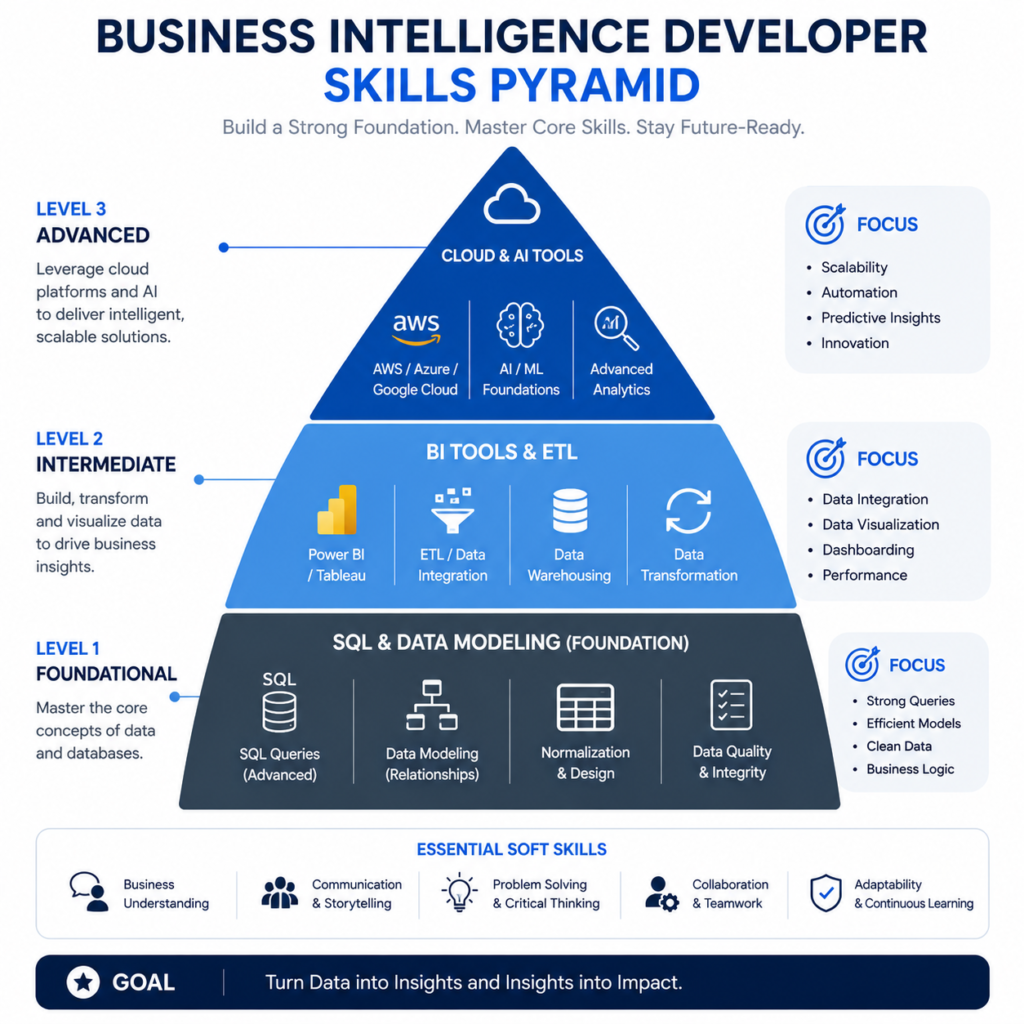
SQL Skills That Separate Beginners From Professionals
Every business intelligence developer I’ve worked with who was genuinely skilled — the ones companies actually compete to hire — had SQL down cold. Not just SELECT statements. I mean window functions, CTEs, subqueries, query optimization, and an understanding of execution plans.
Here’s what actually works when learning SQL: stop doing isolated exercises and start writing queries against real business questions. ‘What were our top 10 products by revenue last quarter, broken down by region and compared to the same period last year?’ — that kind of question forces you to learn JOINs, aggregations, date functions, and CTEs simultaneously.
- Window functions: ROW_NUMBER, RANK, LAG, LEAD, SUM OVER
- CTEs for readable, reusable query logic
- Subqueries and correlated subqueries
- Query optimization and index awareness
- Database-specific dialects: T-SQL (SQL Server), PostgreSQL, BigQuery SQL
Why Data Modeling Is More Important Than Fancy Dashboards
I’ll say this plainly: I’ve seen senior BI developers with mediocre dashboards who were absolutely irreplaceable because their data models were bulletproof. I’ve also seen visually stunning dashboards built on models so bad that the numbers were wrong half the time. The latter got people fired.
Data modeling for BI means understanding dimensional modeling: star schemas, snowflake schemas, fact tables, dimension tables, slowly changing dimensions. It means knowing how to structure data so that a Power BI report with 1 million rows doesn’t load in 45 seconds.
| 💡 Pro Tip |
| Learn the Kimball methodology for dimensional modeling. It’s the industry standard for BI data warehouse design and understanding it will separate you from 80% of candidates. |
Power BI vs Tableau vs Looker
| Criteria | Power BI | Tableau | Looker |
| Market Share | Dominant (Microsoft ecosystem) | Strong enterprise presence | Growing (Google Cloud) |
| Learning Curve | Moderate | Moderate-High | High (LookML) |
| Best For | Microsoft shops, SMBs | Enterprise analytics, data viz | Cloud-native, data teams |
| Pricing | Affordable | Higher cost | Enterprise pricing |
| Job Demand 2026 | Very High | High | Growing |
| AI Integration | Copilot built-in | Pulse AI features | Looker Studio AI |
From my experience, if you’re choosing where to invest your time: start with Power BI. It has the highest job demand, the most accessible learning resources, and Microsoft’s Copilot integration is genuinely useful. Tableau is worth learning if you’re targeting larger enterprises. Looker is a long-term play if you want to work with Google Cloud or data-forward tech companies.
ETL and Data Pipeline Fundamentals
ETL stands for Extract, Transform, Load — the process of pulling data from source systems, cleaning and reshaping it, and loading it into a data warehouse. In 2026, many organizations have shifted to ELT (load first, transform later using tools like dbt), but the concepts remain the same.
As a business intelligence developer, you need to understand how data moves from operational systems (CRMs, ERPs, databases) into your warehouse, what transformations happen in between, and how to troubleshoot when pipelines break — because they will break.
Cloud Skills Companies Now Expect
The days of on-premise SQL Server being the only platform you needed are over. In 2026, most companies run their BI infrastructure in the cloud. The platforms you’ll encounter most often: Azure Synapse Analytics, AWS Redshift, and Google BigQuery. You don’t need to be a cloud engineer, but you do need to understand how to query cloud data warehouses, manage datasets, and connect BI tools to cloud sources.
Business Communication Skills Most Developers Ignore
Here’s the uncomfortable truth: many technically strong BI developers plateau at mid-level because they can’t translate their work for non-technical stakeholders. A CFO doesn’t care about your data model — they care whether the revenue dashboard is accurate and whether they can trust it. Learning to communicate data insights clearly, ask the right questions before building anything, and present your work in business terms is genuinely career-defining.
| 🔑 Key Takeaways |
| SQL (advanced) is the single most important skill for BI developers |
| Data modeling knowledge differentiates good developers from great ones |
| Power BI has the highest 2026 job demand — start there |
| Cloud platform familiarity (Azure, AWS, GCP) is now expected |
| Business communication skills are the hidden career multiplier |
The Modern BI Developer Tech Stack
The specific tools vary by company, but here’s what I consistently see in job descriptions and real BI environments in 2026:
Reporting Tools Used by Most Companies
- Power BI — dominant in mid-market and enterprise Microsoft environments
- Tableau — strong in larger enterprises, especially finance and healthcare
- Looker — growing in tech companies using Google Cloud
- SSRS (SQL Server Reporting Services) — still heavily used in legacy Microsoft environments
- Qlik Sense — niche but active in certain industries
Databases Every BI Developer Should Understand
- SQL Server — ubiquitous in enterprise environments
- PostgreSQL — popular in startups and cloud environments
- Snowflake — the cloud data warehouse of choice for many modern stacks
- BigQuery — dominant in Google Cloud environments
- Azure Synapse Analytics — Microsoft’s integrated analytics service
- Amazon Redshift — common in AWS-heavy organizations
Cloud Platforms Dominating BI Workflows
- Microsoft Azure — Azure Data Factory, Synapse Analytics, Power BI Premium
- Google Cloud Platform — BigQuery, Looker, Dataflow
- AWS — Redshift, Glue, QuickSight
Tools That Help Automate Reporting
- dbt (data build tool) — transforms data in the warehouse using SQL
- Apache Airflow — orchestrates data pipeline workflows
- Azure Data Factory — cloud ETL and data integration
- Fivetran / Airbyte — automated data connectors
AI Tools Changing BI Development
- Microsoft Copilot for Power BI — AI-generated insights and report creation
- Looker AI — natural language querying and automated analysis
- GitHub Copilot — accelerates SQL and DAX formula writing
- ChatGPT / Claude — useful for debugging queries and writing documentation
| 💡 Pro Tip |
| You don’t need to master every tool in this stack. Focus on SQL + one BI platform + one cloud platform for your first role. Breadth comes with experience. |
Step-by-Step Roadmap to Become a Business Intelligence Developer
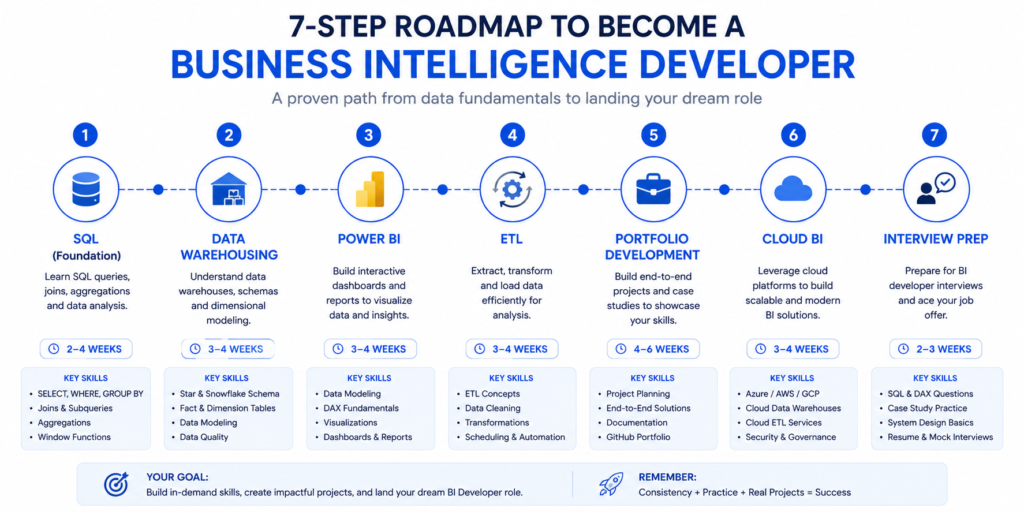
Step 1: Learn SQL Properly
Don’t rush this step. SQL is the foundation that everything else rests on. Spend 4–6 weeks learning SQL properly — not just basic queries, but joins, aggregations, window functions, CTEs, and subqueries. Use real datasets, not toy examples. The AdventureWorks or Northwind databases are good starting points.
What actually works: write 2–3 SQL queries every day against business-style questions. By week 6, you should be able to write a multi-table query with window functions without looking anything up.
Step 2: Understand Data Warehousing Basics
Before you build a single dashboard, understand where the data comes from and how it should be organized. Learn the concepts of OLTP vs OLAP databases, star schema vs snowflake schema, fact tables, dimension tables, and why data warehouses are structured differently from transactional databases. The Kimball Group’s resources are the gold standard here.
Step 3: Build Dashboards With Power BI
Once you understand data structure, start learning Power BI. Focus on: connecting to data sources, building data models within Power BI, writing DAX formulas (Power BI’s formula language), and designing clean, readable dashboards. DAX is its own language — budget 3–4 weeks specifically for it.
To understand how Power BI fits into the broader data analytics toolkit, this guide on data analytics tools covers the landscape well.
Step 4: Learn ETL and Data Transformation
Learn how data moves from source systems into a data warehouse. Start with Azure Data Factory or SSIS for ETL, then explore dbt for transformation logic. Understanding this layer makes you dramatically more valuable than a BI developer who can only work with data that’s already been cleaned and loaded.
Step 5: Create Portfolio Projects That Look Real
Your portfolio needs to demonstrate that you can solve real business problems, not just replicate tutorials. Build 3–4 end-to-end projects that include: a data source (even public datasets), an ETL process, a data model, and a dashboard with business context. We’ll cover specific project ideas later in this guide.
Step 6: Learn Cloud-Based BI Workflows
Pick one cloud platform and learn how BI works within it. If you’re targeting Microsoft-heavy companies, focus on Azure (Synapse Analytics + Power BI Premium). If you want to work with tech companies or startups, BigQuery + Looker or AWS Redshift + QuickSight are strong alternatives.
Step 7: Prepare for BI Developer Interviews
BI developer interviews typically involve: SQL coding tests (sometimes live coding), data modeling questions, BI tool demonstrations, and behavioral questions about working with stakeholders. The SQL test is almost always present. Practice writing queries under time pressure using platforms like StrataScratch or DataLemur.
For a broader view of what the data career path looks like beyond BI, the data analyst roadmap for career growth is a useful reference — especially for understanding adjacent roles.
What Actually Works When Learning Business Intelligence
The Fastest Way to Learn SQL
Stop doing isolated SQL exercises on platforms that give you pre-cleaned, perfectly structured data. Real SQL skill comes from working with messy, real-world datasets. Download a public dataset from Kaggle or data.gov, load it into PostgreSQL or SQL Server, and try to answer actual business questions from it. The friction of dealing with nulls, inconsistent formats, and complex relationships is where real learning happens.
Why Most Dashboard Tutorials Fail Beginners
Most dashboard tutorials teach you the mechanics — how to drag a field, how to create a bar chart, how to add a filter. What they don’t teach is the decision-making process: why this chart type instead of that one, how to structure a dashboard so executives actually read it, why a KPI card is sometimes more valuable than a beautiful visualization.
The best dashboard learning I’ve seen happens when you take an existing business report — even a simple Excel one — and rebuild it in Power BI while thinking constantly about the end user’s questions, not the tool’s features.
Learning Through Real Business Problems
Here’s a framework I recommend: find a public company’s investor relations page. Look at their quarterly earnings report. Try to recreate the key metrics they report on using publicly available data. Revenue by segment, year-over-year growth, operating margins. This forces you to think like a real BI developer, not a tutorial follower.
Building End-to-End BI Projects
The projects that actually impress hiring managers aren’t the most visually impressive ones — they’re the ones that show end-to-end thinking. A project that shows: here’s my data source, here’s how I modeled it, here’s why I chose this structure, here’s the dashboard I built, and here’s the business question it answers. That narrative is what gets you hired.
| ⚠️ Common Mistakes to Avoid |
| Starting with dashboards before learning SQL and data modeling |
| Building projects that are just recreated tutorials with different data |
| Learning five BI tools superficially instead of one deeply |
| Ignoring the business context behind the data |
| Skipping ETL and assuming clean data will always exist |
Beginner vs Advanced BI Developer Skills
| Skill Area | Junior BI Developer | Mid-Level BI Developer | Senior BI Developer |
| SQL | Basic queries, JOINs, GROUP BY | Window functions, CTEs, optimization | Query tuning, execution plans, indexing strategy |
| Data Modeling | Understands star schema concept | Builds star schemas independently | Designs enterprise data warehouse architecture |
| BI Tools | Creates basic reports and charts | Builds complex interactive dashboards | Governs BI platform, row-level security, performance |
| ETL | Understands ETL concept | Builds and monitors basic pipelines | Architects enterprise ETL/ELT solutions |
| Cloud | Familiar with one cloud platform | Works in cloud data warehouse (BigQuery, Redshift) | Designs cloud BI architecture |
| Business Acumen | Asks good questions | Translates requirements into data models | Defines KPIs and data strategy |
Skills Expected From Junior BI Developers
At the junior level, companies are looking for foundational SQL skills, basic Power BI or Tableau proficiency, some understanding of data modeling concepts, and most importantly — curiosity and a willingness to learn. Your portfolio matters more than your credentials at this stage.
What Mid-Level BI Developers Usually Handle
Mid-level BI developers own reporting solutions end-to-end. They gather requirements from stakeholders, design the data model, build the ETL pipeline, create the dashboard, and handle ongoing maintenance. They’re also starting to mentor junior developers and push back when business requirements don’t make data sense.
Advanced Skills Senior BI Developers Need
Senior BI developers move into architecture and strategy. They’re designing the data warehouse, making platform decisions, establishing governance standards, and working closely with data engineering and leadership teams. Technical depth is expected, but organizational influence is what actually defines seniority at this level.
Business Intelligence Developer vs Data Analyst vs Data Engineer
| Dimension | BI Developer | Data Analyst | Data Engineer |
| Primary Focus | Reporting systems & dashboards | Analysis & insights | Data infrastructure & pipelines |
| Core Skills | SQL, BI tools, data modeling | SQL, Excel, statistics, Python | Python/Scala, Spark, Airflow, cloud |
| Output | Dashboards, reports, data models | Analysis reports, ad-hoc queries | Data pipelines, data lakes, APIs |
| Business Contact | High — works with stakeholders | Very high — answers business Qs | Lower — more backend focused |
| Avg Salary (US 2026) | $90k – $130k | $70k – $105k | $105k – $150k |
| Entry Barrier | Moderate | Low-Moderate | High |
Reporting vs Engineering Responsibilities
BI developers own the reporting layer — they make data accessible and understandable for business users. Data engineers own the infrastructure layer — they build the systems that collect, store, and move data at scale. There’s meaningful overlap, especially at smaller companies where one person does both, but they’re distinct disciplines with different skill emphases.
Which Role Pays More
Data engineers typically earn more than BI developers, and BI developers typically earn more than data analysts. But these are averages — a senior BI developer with cloud certifications and strong stakeholder management skills can absolutely out-earn a junior data engineer. Industry, company size, and location matter enormously.
Which Career Path Fits Different Personalities
If you enjoy building things that business users touch and appreciate — dashboards, reports, analytical tools — BI development is a natural fit. If you prefer working closer to infrastructure, automation, and systems thinking, data engineering will suit you better. If you love the investigative, open-ended nature of answering business questions, data analysis is your lane.
How the Roles Work Together
In well-structured data teams, data engineers build and maintain the pipelines, BI developers model and visualize the data, and data analysts use the outputs to drive business decisions. The roles are interdependent — a BI developer without a solid data engineering foundation underneath them is constantly firefighting data quality issues.
Common Mistakes That Slow Down BI Careers
Learning Too Many Tools Too Early
This is the most common mistake I’ve seen among aspiring BI developers. They spend weeks trying to learn Power BI AND Tableau AND Looker AND Qlik simultaneously, and end up being mediocre at all of them. Pick one BI tool and go deep. Job descriptions that list five tools don’t expect you to be expert-level in all of them — they’re describing their existing environment and listing what they’d love to see.
Building Dashboards Without Understanding Data
A dashboard is only as good as the data model underneath it. I’ve reviewed portfolio projects where the dashboards looked excellent but the underlying data was queried directly from a flat file with no modeling. Any experienced BI interviewer will spot this immediately. Always build your data model first.
Ignoring Data Modeling
Data modeling is the least exciting-sounding topic in BI, which is why so many people skip it. Don’t. Spend time understanding star schemas, slowly changing dimensions, and why dimensional modeling exists. It’s the conceptual framework that makes everything else in BI make sense.
Copying Portfolio Projects From YouTube
Tutorial projects look like tutorial projects. Hiring managers see dozens of ‘Superstore Sales Dashboard’ projects. Build something that reflects a real industry problem relevant to the type of company you want to work for. Healthcare analytics for a hospital role, logistics KPIs for a supply chain role, marketing attribution for a digital agency.
Not Learning Business Context
The most technically skilled BI developer I’ve ever seen fail an interview did so because they couldn’t explain their design decisions in business terms. ‘I created a fact table here’ is less powerful than ‘I structured this as a fact table so the sales team could slice revenue by any combination of product, region, and time period without performance issues.’ Speak the language of outcomes, not just implementation.
Real Examples of Business Intelligence Projects
These are the types of projects that actually demonstrate BI developer skills. Each one involves the full stack: data source, modeling, ETL, and visualization.
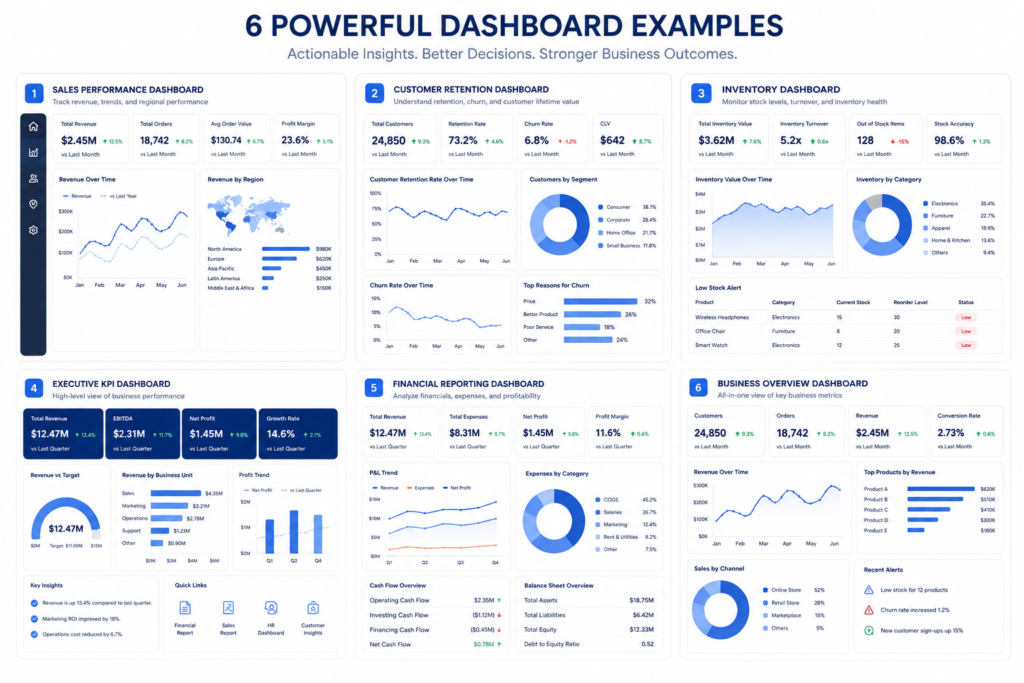
Sales Performance Dashboard
Data Source: AdventureWorks or Kaggle sales dataset. Build a star schema with a sales fact table and dimension tables for customers, products, regions, and dates. Create a Power BI dashboard showing: revenue by region over time, product performance, sales rep rankings, and year-over-year comparisons. Include drill-through capability from summary to individual transactions.
Customer Retention Analytics
Data Source: E-commerce transaction data (publicly available on Kaggle). Calculate customer cohort retention rates, CLV (customer lifetime value), churn indicators, and repeat purchase rates. This project demonstrates both SQL complexity and the ability to answer questions that directly impact business revenue.
Inventory Forecasting Dashboard
Data Source: Retail inventory dataset. Build a dashboard showing current stock levels, days of supply, stockout risk by SKU, and slow-moving inventory. This type of project is directly relevant for retail, logistics, and supply chain companies — industries with high BI demand.
Executive KPI Reporting System
Build a reporting system that simulates what a CFO or CEO would actually look at: revenue, gross margin, operating expenses, headcount, and rolling forecasts. The key here is clean, high-level design — executives don’t want complexity, they want clarity. This tests your business communication as much as your technical skills.
Financial Reporting Automation
Take a company’s historical financial data and automate the monthly reporting process. Build an ETL pipeline that loads data, a data model that structures it correctly, and a set of standard reports (P&L, balance sheet summary, cash flow) in Power BI. This project signals to finance-sector employers that you understand their domain.
Certifications That Still Matter in 2026
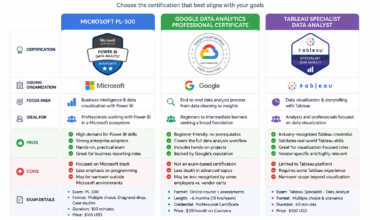
Microsoft Power BI Certifications
The PL-300: Microsoft Power BI Data Analyst certification is the most directly relevant certification for business intelligence developers focused on Power BI. It validates your ability to prepare data, model data, visualize data, and deploy solutions. In 2026, this certification still carries real weight in job applications, especially for roles in Microsoft-heavy environments.
Azure Data Certifications
The DP-900 (Azure Data Fundamentals) is a solid starting point for cloud data concepts. The DP-203 (Azure Data Engineer Associate) is more advanced and valuable for BI developers who want to work across the full Azure data stack. The DP-500 (Azure Enterprise Data Analyst Associate) is specifically designed for Power BI and Azure Synapse integration — highly relevant for senior BI developers.
Google and AWS Analytics Certifications
Google’s Professional Data Engineer and Professional Cloud Database Engineer certifications are valuable if you’re targeting Google Cloud environments. AWS offers the AWS Certified Data Analytics – Specialty certification, which covers Redshift, Glue, and QuickSight — the AWS BI stack.
Which Certifications Are Worth the Time
| Certification | Provider | Relevance | Difficulty | Recommended? |
| PL-300 Power BI Data Analyst | Microsoft | Very High | Moderate | Yes — start here |
| DP-203 Azure Data Engineer | Microsoft | High | High | Yes — for cloud BI |
| DP-500 Enterprise Data Analyst | Microsoft | Very High | High | Yes — for senior roles |
| AWS Data Analytics Specialty | AWS | Medium-High | High | Yes — if targeting AWS |
| Google Professional Data Engineer | Medium | High | Situational | |
| Tableau Desktop Specialist | Tableau | Medium | Moderate | If targeting Tableau roles |
For a broader look at which data certifications are genuinely worth pursuing vs. which are just resume padding, this data analyst certifications guide breaks it down clearly.
Business Intelligence Developer Salary and Career Growth
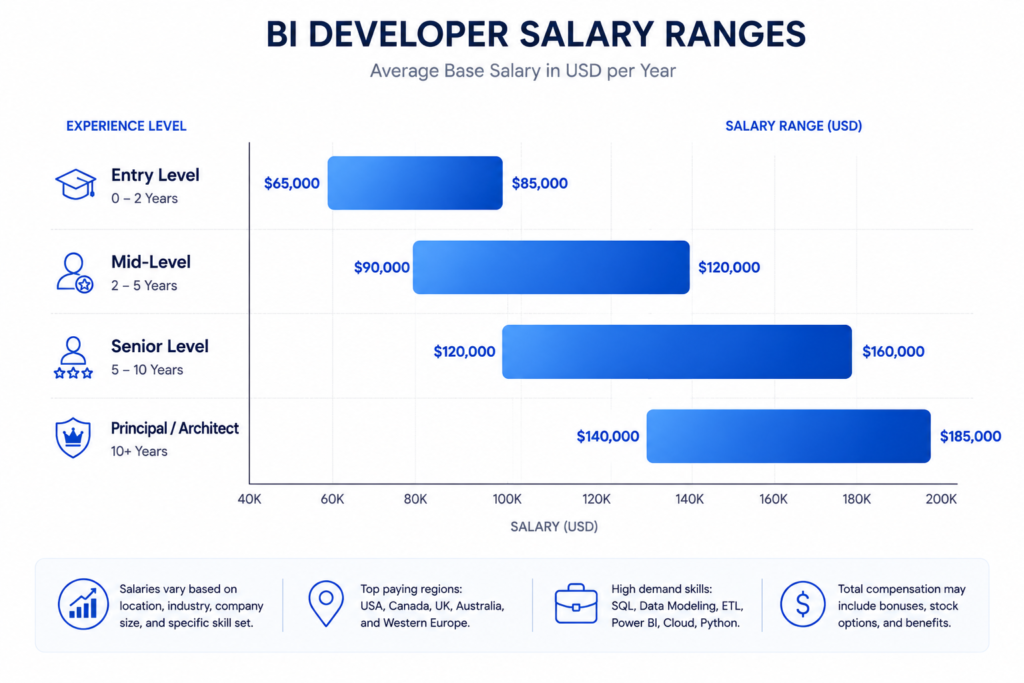
Entry-Level Salary Expectations
Entry-level business intelligence developer salaries in the United States typically range from $65,000 to $85,000 annually in 2026. In major tech hubs like San Francisco, New York, or Seattle, this can stretch to $90,000–$100,000. In smaller markets, expect $55,000–$70,000. With a solid portfolio and a relevant certification like PL-300, you’re much more likely to land at the higher end of entry-level ranges.
Mid-Level and Senior Salary Trends
Mid-level BI developers with 3–5 years of experience earn between $90,000 and $120,000 in most US markets. Senior BI developers — typically 6+ years of experience with architecture and leadership responsibilities — earn $120,000 to $160,000+. Principal-level roles at larger organizations can reach $185,000 when total compensation is included.
Globally, BI developer salaries vary significantly. In the UK, mid-level roles average £55,000–£75,000. In Australia, AUD $90,000–$120,000 is typical. Remote work has compressed some of these geographic differentials, but US-based remote roles still tend to pay the highest globally.
Remote BI Opportunities
Remote BI development is genuinely available in 2026. Many companies that run cloud-based BI infrastructure have no compelling reason to require on-site presence. The roles that are most remote-friendly are those at companies with mature cloud data stacks — they have the infrastructure to support distributed data teams.
Industries Hiring BI Developers Most Aggressively
- Financial services and banking — highest average salaries
- Healthcare and pharmaceutical — growing rapidly post-pandemic
- Retail and e-commerce — strong demand for customer analytics
- Technology and SaaS — strong pay, often remote-friendly
- Manufacturing and logistics — supply chain analytics driving demand
- Consulting firms — broad exposure, faster skill development
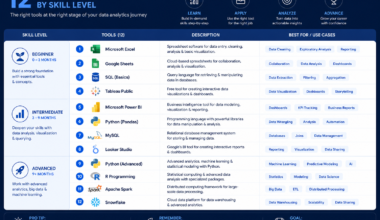
Tools and Resources That Make Learning Easier
Best Platforms to Learn SQL
- Mode Analytics SQL Tutorial — free, business-focused SQL learning
- StrataScratch — real interview SQL problems from actual companies
- DataLemur — SQL interview prep with difficulty ratings
- LeetCode (Database section) — good for interview preparation
- SQLZoo — beginner-friendly interactive SQL learning
Power BI Learning Resources
- Microsoft Learn — free official Power BI learning paths
- SQLBI.com — the gold standard for DAX formula learning (by Marco Russo and Alberto Ferrari)
- Guy in a Cube (YouTube) — practical Power BI tutorials with business context
- Maven Analytics — excellent structured BI and Power BI courses
BI Project Dataset Sources
- Kaggle Datasets — enormous library of free real-world datasets
- data.gov — US government open data
- AdventureWorks / Northwind — classic SQL Server sample databases
- Makeover Monday — weekly data visualization challenges with downloadable datasets
- Our World in Data — reliable, well-sourced public datasets
Communities and Forums Worth Joining
- Power BI Community (community.powerbi.com) — official Microsoft forum
- r/BusinessIntelligence (Reddit) — honest career discussions
- dbt Community Slack — active community for modern data stack practitioners
- LinkedIn — follow BI leaders and engage with data content regularly
If you’re exploring the broader landscape of data learning platforms, this overview of data analyst courses for beginners covers many platforms that also apply to BI learning.
Practical Checklist Before Applying for BI Developer Jobs
Technical Skills Checklist
- Can write complex SQL queries (window functions, CTEs, subqueries) without reference
- Can build a star schema data model from business requirements
- Can create a complete Power BI report including data model and DAX measures
- Understands ETL concepts and has built at least one pipeline
- Familiar with at least one cloud data warehouse platform
- Can explain query performance issues and basic optimization strategies
Portfolio Checklist
- At least 3 end-to-end projects (not tutorial replications)
- Each project includes: data source documentation, data model diagram, dashboard, and business problem statement
- Projects are hosted and accessible (Power BI published reports, GitHub for SQL and ETL code)
- Projects represent different business domains or problem types
- At least one project involves an ETL pipeline, not just pre-cleaned data
Resume Optimization Checklist
- Resume includes quantified achievements, not just job descriptions
- Technical skills section organized by category (SQL, BI Tools, Cloud, ETL)
- Focus on outcomes: ‘Built sales dashboard used by 50+ stakeholders’ not ‘Created Power BI reports’
- Relevant certifications listed with exam codes
- Portfolio link prominently featured
LinkedIn Optimization Tips
- Headline includes ‘Business Intelligence Developer’ and key tools
- About section written in first person with clear value proposition
- Portfolio projects featured in the ‘Featured’ section
- Skills section endorsed for SQL, Power BI, and data modeling
- Regular posting or engagement with BI-related content signals active interest
Frequently Asked Questions
Is Business Intelligence Development a Good Career in 2026?
Yes — and the data backs it up. BI development sits at the intersection of high business demand, reasonable supply of qualified candidates, and strong compensation. The role is evolving with AI integration, but core BI skills (SQL, data modeling, visualization) are not being automated away. If anything, AI is making BI developers more productive, which increases their value.
Can I Become a BI Developer Without a Computer Science Degree?
Absolutely. From my experience, many of the strongest BI developers I’ve worked with came from business, economics, or finance backgrounds — or had no degree at all. Companies hiring BI developers are primarily evaluating your portfolio, your SQL skills, and your ability to understand business context. A degree helps but it’s not a gatekeeper. Your project work matters far more.
Do BI Developers Need Python?
Python is not required for most BI developer roles in 2026, but it’s increasingly useful. If you want to automate report distribution, build custom ETL scripts, or work with data science teams, Python knowledge is a genuine differentiator. Start with SQL, Power BI, and one cloud platform — add Python once you’re comfortable with the core stack.
How Long Does It Take to Become Job-Ready?
With focused effort (10–15 hours per week), most people can become job-ready for an entry-level BI developer role in 6–9 months. This assumes covering SQL, data modeling, Power BI, basic ETL concepts, and building 3–4 strong portfolio projects. Going faster than 6 months usually means cutting corners on data modeling or portfolio quality — which shows in interviews.
Is Power BI Enough to Get a Job?
Power BI alone is not enough. Companies want BI developers who understand the full data lifecycle, not just the visualization layer. Power BI proficiency combined with strong SQL and data modeling skills is enough to be competitive for entry-level roles. Adding ETL knowledge and cloud familiarity moves you firmly into hireable territory.
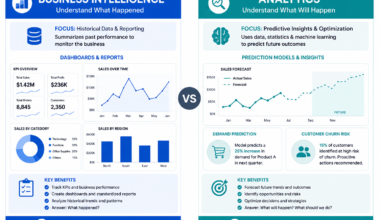
What Is the Difference Between BI and Data Analytics?
Business intelligence focuses on building the systems and infrastructure that enable reporting — data warehouses, ETL pipelines, dashboards, and standardized metrics. Data analytics focuses on using those systems to answer specific business questions through analysis, often involving more exploratory and statistical work. BI developers build the tools; data analysts use them. In smaller organizations, one person often does both.
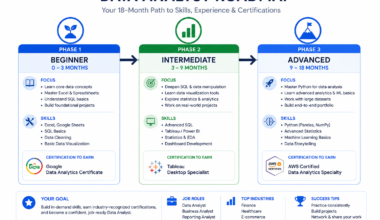
Final Action Plan: The Smartest Way to Start Your BI Developer Journey
The 90-Day Beginner Plan
| Month | Focus | Weekly Hours | Milestone |
| Month 1 | SQL Mastery | 10–15 hrs | Write complex queries confidently |
| Month 2 | Data Modeling + Power BI | 10–15 hrs | Complete first end-to-end project |
| Month 3 | ETL + Portfolio + Interview Prep | 12–15 hrs | 3 portfolio projects, start applying |
What to Learn First
- SQL — minimum 4 weeks, focusing on real business queries
- Relational database concepts and data modeling fundamentals
- Power BI: data connections, data model, DAX basics, and dashboard design
- ETL concepts: understand Extract, Transform, Load with one practical tool
- Build your first end-to-end portfolio project
What to Avoid
- Spending more than 2 weeks on any one tutorial without building something
- Learning Tableau, Looker, AND Power BI simultaneously — pick one
- Building only dashboard-layer projects without data modeling or ETL
- Treating portfolio projects as learning exercises instead of professional showcases
- Waiting until you feel ‘ready’ to apply — start applying at month 3
How to Stay Competitive in the AI Era
The AI era doesn’t make BI fundamentals less important — it makes them more important. When AI tools can generate a basic dashboard from a prompt, companies will need BI developers who can evaluate AI-generated output, fix its data modeling assumptions, and ensure the underlying logic is sound. That requires deep fundamentals, not surface-level tool knowledge.
What I recommend: learn to use AI tools in your BI workflow today. Use Copilot in Power BI, use ChatGPT or Claude to debug your DAX or SQL, use GitHub Copilot when writing transformation logic. The goal isn’t to avoid AI — it’s to be the person who uses it most effectively.
| 🚀 Your Next Steps |
| 1. Install SQL Server Express or sign up for a free PostgreSQL cloud instance |
| 2. Download the AdventureWorks sample database and start writing queries |
| 3. Sign up for a free Power BI account (powerbi.microsoft.com) |
| 4. Follow the SQLBI.com DAX learning path |
| 5. Identify 3 business problems you want to solve with your portfolio projects |
| 6. Set a target date for your PL-300 certification exam |
| 7. Connect with BI professionals on LinkedIn and engage with the community |
Ready to build the analytical foundation that supports great BI work? Start with this guide on data analyst courses for beginners — the skills overlap significantly and will accelerate your BI development learning.