If you have ever Googled ‘data analyst roadmap’ and ended up more confused than when you started, you are not alone. I have spoken to hundreds of beginners who spent months watching tutorials, collecting certificates, and still could not land a single interview.
Here is the truth: most beginners fail not because they are not smart enough, but because they follow the wrong learning order. They jump into Python before understanding SQL. They build random projects nobody cares about. They collect tools instead of building skills.
From my experience mentoring beginners through this exact transition, the roadmap to become a data analyst in 2026 is clearer than ever — but only if you follow it in the right sequence. This guide shows you precisely what to learn, when to learn it, and what you can safely skip right now.
Whether you are a complete beginner, a professional switching careers, or someone who has already started but feels lost, this data analyst road map is designed to get you job-ready without wasting a single month.
| Why You Can Trust This Guide |
| This guide is built from real hiring patterns, interview feedback, and hands-on mentoring experience. |
| It reflects what recruiters actually look for in 2026, not theory. |
| Sections are updated to reflect AI tools, cloud platforms, and modern portfolio expectations. |
| Every skill recommendation is backed by job posting data and analyst community discussions. |
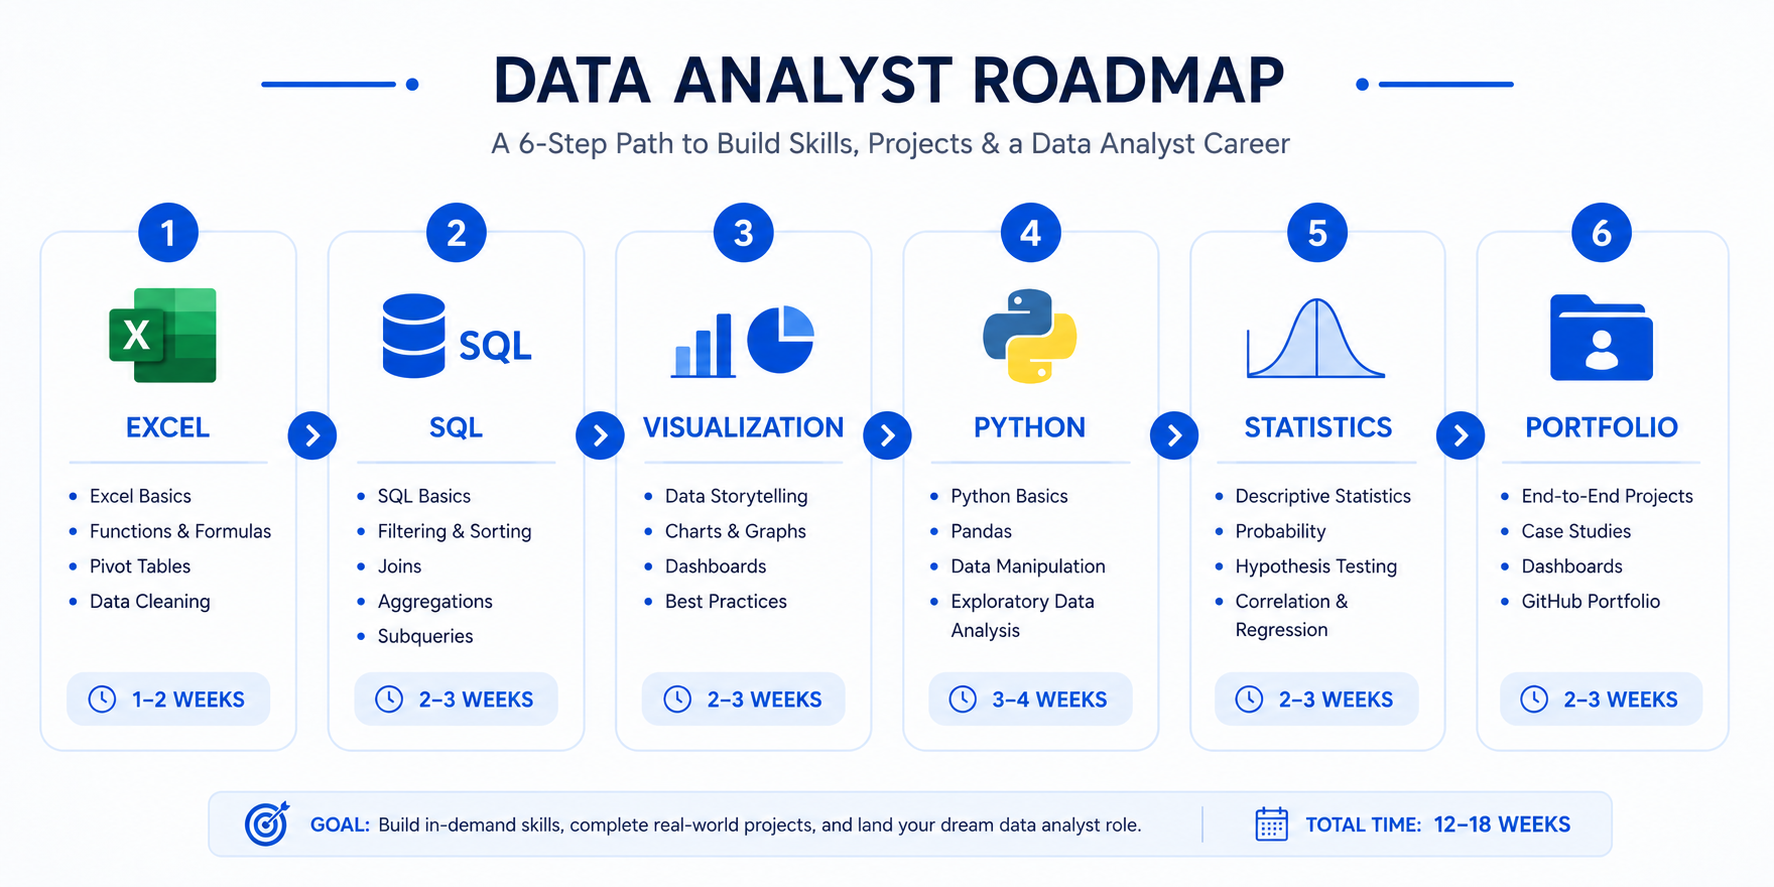
The Fastest Overview of the Modern Data Analyst Roadmap
Before diving deep, here is the clearest summary of the entire roadmap for data analytics in one place. Most beginners spend weeks trying to piece this together from random YouTube videos. I am saving you that time right now.
| Stage | Focus Area | Estimated Time | Priority |
| 1 | Excel + Business Thinking | 3–4 weeks | Critical |
| 2 | SQL Fundamentals | 4–6 weeks | Critical |
| 3 | Data Visualization (Power BI / Tableau) | 4–5 weeks | High |
| 4 | Python Basics for Analysts | 5–6 weeks | Medium |
| 5 | Statistics and Analytical Thinking | 3–4 weeks | Medium |
| 6 | Portfolio, GitHub, and Job Applications | 4–6 weeks | Critical |
The 6 Core Stages of Becoming a Data Analyst

The roadmap of data analyst careers follows a logical progression. Every stage builds on the last. Skipping stages is the single biggest reason beginners stall.
- Stage 1: Business thinking and Excel — the foundation most people dismiss
- Stage 2: SQL — the skill that gets your resume past the first filter
- Stage 3: Visualization — how you communicate insights, not just find them
- Stage 4: Python — powerful when added at the right time
- Stage 5: Statistics — enough to think analytically, not to pass an exam
- Stage 6: Portfolio and job strategy — what actually converts skills into offers
What Skills Employers Actually Expect Today
From analyzing hundreds of entry-level data analyst job postings in 2026, the most in-demand skills are SQL (appearing in 87% of listings), Excel (73%), Power BI or Tableau (68%), and Python (55%). Statistics and business communication appear less explicitly but are tested in interviews.
| Key Takeaway |
| You do not need to master everything before applying. Employers hiring junior analysts prioritize SQL, Excel, and one visualization tool above everything else. |
Start Here First: The Foundation Skills That Actually Matter
The most common mistake I see in every beginner data analyst roadmap is jumping straight into tools without building a thinking foundation first. This is why people complete 40 hours of SQL courses and still cannot answer ‘how would you measure whether this marketing campaign worked?’
Why Excel Still Matters More Than Most Beginners Think
I still see LinkedIn posts dismissing Excel as outdated. What I have seen in real interviews tells a completely different story. Excel is tested in more analyst hiring processes than Python. It teaches core data thinking — filtering, sorting, aggregating, and creating calculated columns — in a visual, forgiving environment that builds intuition fast.
More importantly, Excel is used daily in 90% of analyst roles, even when more advanced tools are also available. Dismissing Excel is a beginner mistake that experienced analysts never make.
Business Thinking Before Technical Skills
Here is what actually gets interviews in 2026: the ability to frame a business problem and propose a measurement approach. Technical skills are table stakes. Analytical thinking is the differentiator.
Before writing a single SQL query, understand what a KPI is, how businesses track performance, and why a specific metric matters. Ask yourself: ‘If I had this data, what decision would it help someone make?’
Understanding Data Types, KPIs, and Metrics
- Dimensions vs measures: what they are and why the distinction matters
- Common KPIs: CAC, LTV, churn rate, conversion rate, NPS
- Categorical vs continuous data — how this affects your analysis choices
- Granularity: why the same data at different levels tells different stories
| Pro Tip |
| Before learning any tool, spend one week reading about how businesses measure success. Read the annual reports of companies you admire. Find their metrics. Ask what data would track each one. This exercise will make every technical skill you learn 3x more effective. |
Learn Excel the Practical Way
I want to be direct with you: learning Excel for data analysis is not the same as learning Excel for office work. The skills recruiters care about are specific and learnable in 3 to 4 focused weeks.
The Excel Skills Recruiters Still Expect
- VLOOKUP and XLOOKUP — data merging without code
- IF, SUMIF, COUNTIF, and nested logical functions
- Dynamic arrays: FILTER, UNIQUE, SORT, SEQUENCE
- Text functions: TRIM, LEFT, RIGHT, MID, CONCATENATE
- Date functions for time-based analysis
Pivot Tables and Dashboards Beginners Should Master
Pivot tables are the closest thing Excel has to SQL GROUP BY. They allow you to summarize millions of rows in seconds, slice data by dimensions, and spot patterns without writing code. Any analyst who cannot use pivot tables fluently will struggle in real-world roles.
For dashboards, focus on clarity over complexity. A three-chart dashboard that answers a clear business question impresses recruiters more than a twenty-widget mess nobody can interpret.
Mistakes That Make Excel Learning Ineffective
- Watching Excel tutorials without a real dataset to practice on
- Memorizing functions without understanding when to apply them
- Skipping pivot tables because they ‘look complicated’
- Building dashboards before understanding what question the dashboard answers
SQL Is the Real Gateway Skill
If I had to pick one skill that determines whether a beginner gets past the first round of interviews, it is SQL. Every analyst role I have researched requires it. Most entry-level technical tests are SQL-based. And yet, most beginners treat it as secondary to Python or visualization tools. That is a critical mistake.
Why SQL Is More Important Than Python Initially
Python is powerful. But SQL is foundational. Data lives in databases. Every meaningful query, every business report, and every dashboard starts with a SQL query extracting the right data. Learning Python before SQL is like learning to drive a race car before you can read a map.
The Exact SQL Topics to Learn in Order
- SELECT, FROM, WHERE — filtering rows with conditions
- GROUP BY and aggregate functions — COUNT, SUM, AVG, MAX, MIN
- JOINs — INNER, LEFT, RIGHT, FULL OUTER — with real examples
- Subqueries and CTEs (WITH clauses) for readable complex queries
- Window functions — ROW_NUMBER, RANK, LAG, LEAD
- Date functions and string manipulation
- CASE WHEN for conditional logic
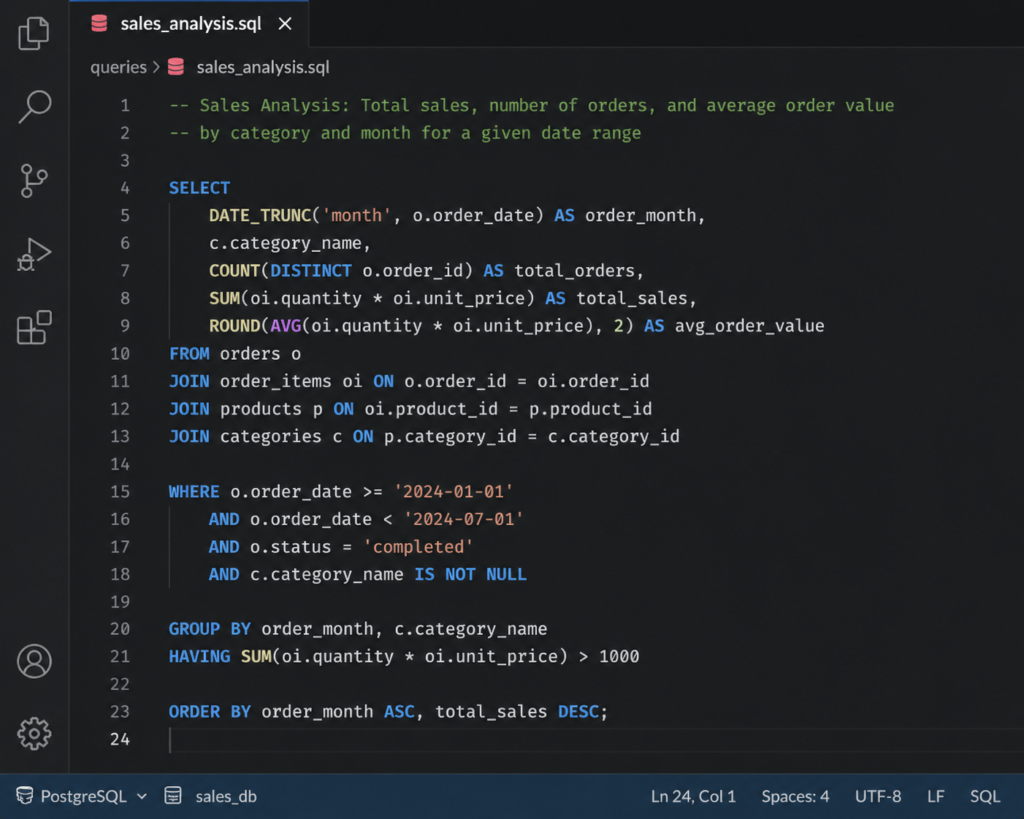
Real Query Examples Analysts Use Daily
What I have found working with real analyst teams is that 80% of daily SQL involves joining two or three tables, filtering by date, and grouping by a business dimension. Window functions come up weekly. Complex recursive CTEs almost never.
Focus your SQL practice on practical business scenarios: ‘Find the top 10 customers by revenue last quarter,’ ‘Calculate the month-over-month retention rate,’ ‘Identify products with declining sales.’
| Common SQL Mistakes That Slow Progress |
| Using SELECT * instead of specifying columns — this is a red flag in interviews. |
| Not understanding the difference between WHERE and HAVING. |
| Ignoring NULL handling — NULLs break aggregations silently. |
| Skipping window functions because they look scary — they appear in 70% of SQL interviews. |
Learn Data Visualization Before Advanced Coding
Here is something most data analyst roadmaps get wrong: they place visualization late in the sequence, after Python and statistics. In my experience, visualization should come third — right after SQL — because it directly connects technical skills to business communication.
What Makes Dashboards Actually Useful
A useful dashboard answers a specific question for a specific audience. Before building anything, ask: Who is reading this? What decision will they make with it? What is the one number they need to see immediately?
The biggest visualization mistake beginners make is building dashboards that impress other analysts but confuse the business stakeholders who actually need to use them.
| Tool | Best For | Learning Curve | Job Demand | Free Tier |
| Power BI | Corporate BI, Microsoft stack | Medium | Very High | Desktop version free |
| Tableau | Enterprise analytics, design quality | Medium-High | High | Tableau Public free |
| Looker Studio | Google ecosystem, web reports | Low | Medium | Fully free |
The Visualization Principles Beginners Ignore
- Choose the right chart type for the data relationship (time = line, composition = bar, comparison = bar not pie)
- Remove chart junk — grid lines, unnecessary borders, redundant labels
- Use color purposefully — highlight what matters, mute what does not
- Always add context — show targets, benchmarks, or prior period comparisons
| Pro Tip |
| Build your first dashboard on a dataset everyone recognizes — sales data, marketing metrics, or sports statistics. Familiar data helps reviewers evaluate your analytical thinking, not just your tool skills. |
When You Should Start Learning Python
Python is the most hyped skill in the data world and also the most misused by beginners. From my experience, the majority of beginners who give up on the data analyst roadmap do so because they started Python too early, before SQL and visualization were solid.
Why Many Beginners Learn Python Too Early
Python is a general-purpose programming language. Learning it without a clear use case means you spend months on syntax, loops, and object-oriented concepts that analysts rarely touch. The result is burnout and discouragement. Learn Python when you have a specific analytical problem that SQL and Excel cannot solve.
The Python Skills Data Analysts Truly Use
- pandas — dataframe manipulation, merging, grouping, reshaping
- NumPy — numerical operations and array handling
- Matplotlib and Seaborn — exploratory data visualization
- Jupyter Notebooks — for documented, shareable analysis
- openpyxl or xlsxwriter — automated Excel report generation
Practical Automation Tasks Analysts Perform
The Python work I see most in analyst roles is automation: pulling data from APIs, combining multiple CSV files, sending scheduled email reports, and cleaning messy datasets. Not machine learning. Not deep statistical modelling. Practical, time-saving automation that makes an analyst 5x more productive.
Statistics Without the Overwhelm
Statistics is the skill most beginners either obsess over or completely ignore. Both extremes are wrong. What actually works is learning just enough statistics to think clearly about data — and nothing more.
The Statistics Concepts Analysts Actually Use
- Mean, median, mode — and when each is more appropriate
- Standard deviation and variance — understanding spread
- Distributions — normal, skewed, and why it matters for analysis
- Correlation vs causation — the most important concept in business analytics
- Confidence intervals and basic hypothesis testing — for A/B test interpretation
- Percentiles and quartiles — used constantly in performance analysis
What Beginners Can Safely Skip Initially
- Regression modelling beyond simple linear regression
- Time series forecasting methods
- Bayesian statistics
- Machine learning algorithms
These topics matter for data science roles. For analyst roles, they are nice-to-have, not requirements.
| Key Takeaway |
| Statistics for analysts is about interpretation, not computation. You need to know what a p-value means in the context of a business decision, not how to derive it from first principles. |
Build Projects Before Taking More Courses
This is the single most important shift in mindset that transforms stuck beginners into hired analysts. At some point, taking more courses is procrastination. Building projects is the real learning.
Why Projects Matter More Than Certificates
Certificates prove you completed a course. Projects prove you can think. Recruiters I have spoken to consistently say a strong portfolio project outweighs three certificates every single time. Projects demonstrate problem-framing, data wrangling, analytical thinking, and communication — all in one deliverable.
Beginner Project Ideas That Look Professional
- Customer churn analysis using a telecom dataset
- Sales performance dashboard using retail transaction data
- COVID-19 recovery trends analysis by country
- E-commerce funnel analysis: from landing page to purchase
- Personal finance tracker with visual reporting
- Job market analysis using public datasets
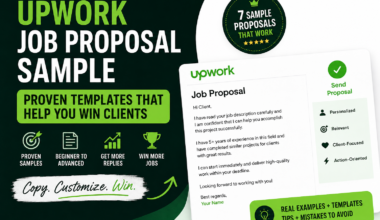
How to Structure a GitHub Analytics Portfolio
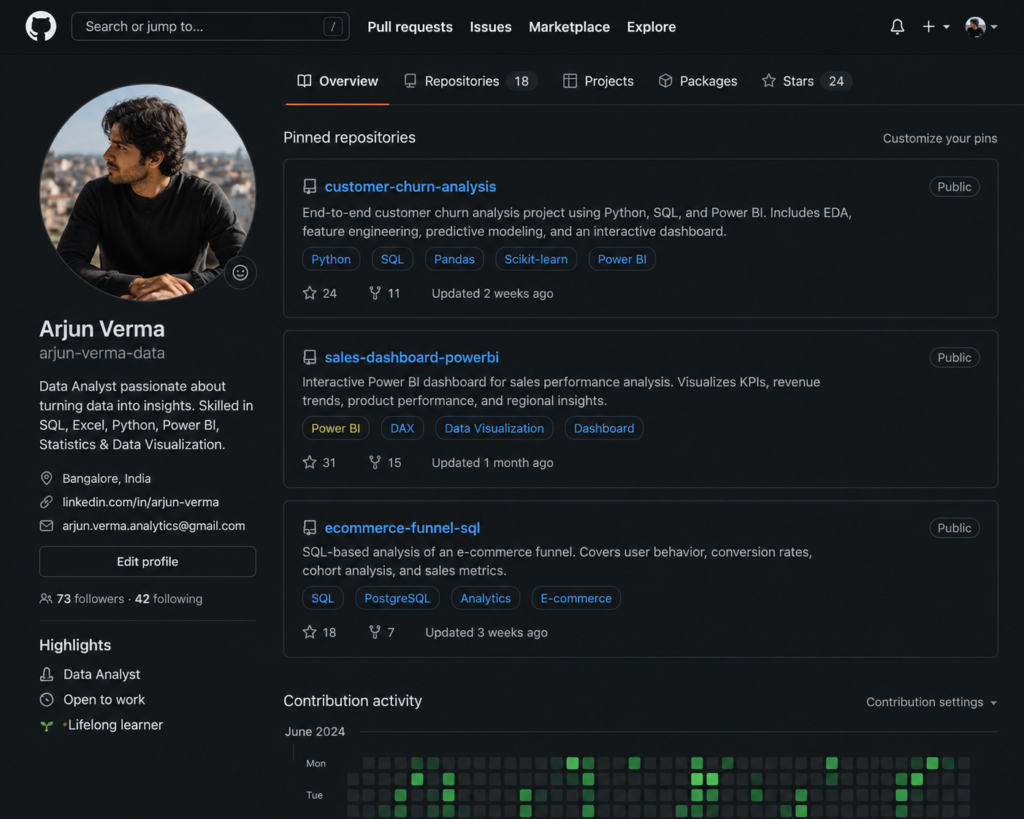
- README.md with clear business question and key finding
- Data cleaning notebook with comments explaining decisions
- Analysis notebook with logical progression from question to insight
- Visualization outputs or embedded dashboard link
- Short written summary in plain language, not analyst jargon
If you are looking for curated project-based courses to build alongside this roadmap, I have reviewed the best options in my guide to data analyst courses for beginners.
The Best Data Analyst Portfolio Strategy in 2026
Most analyst portfolios I review have the same problem: they look like homework submissions, not professional work products. Here is what actually makes a portfolio stand out in 2026.
What Makes a Portfolio Stand Out
- Projects answer real business questions, not just ‘explore this dataset’
- Analysis tells a story — beginning (business problem), middle (data investigation), end (recommendation)
- Visuals are clean and labelled — not default chart styles from any software
- README files are written for non-technical stakeholders, not other analysts
- Each project shows deliberate skill — do not include every beginner exercise
GitHub Mistakes That Hurt Credibility
- Repositories with no README — this is an immediate red flag
- Uploading raw course exercises without customization
- Using datasets from tutorial videos that every other beginner also used (Titanic, Iris)
- Inconsistent file naming and messy folder structures
- Notebooks with no comments or narrative explanation
How to Present Projects Like an Experienced Analyst
The framing of a project matters as much as the analysis itself. Instead of ‘I analyzed this dataset,’ write: ‘I identified that customers who purchase within the first 14 days have 3x higher lifetime value, recommending an early engagement trigger at day 7.’ That is analyst communication.
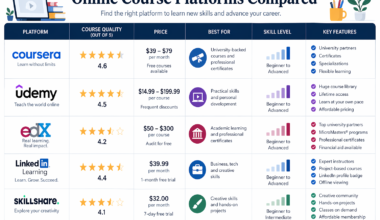
Courses, Certifications, and Resources Worth Your Time
Free vs Paid Learning Platforms
| Platform | Best For | Cost | Certificate |
| Google Data Analytics (Coursera) | Structured beginner roadmap | Paid (financial aid available) | Yes |
| Mode Analytics SQL Tutorial | Hands-on SQL practice | Free | No |
| Kaggle Learn | Python, ML, and data science basics | Free | Yes |
| W3Schools SQL | Quick SQL reference | Free | No |
| Maven Analytics | Excel, Power BI, Tableau courses | Paid | Yes |
Certifications That Actually Help
- Google Data Analytics Professional Certificate — recognized by recruiters and structured well
- Microsoft Power BI Data Analyst (PL-300) — strong signal for corporate BI roles
- Tableau Desktop Specialist — valued in data-heavy industries
- IBM Data Analyst Professional Certificate (Coursera) — good for Python and visualization
I have done a full breakdown of which courses are worth your money in my dedicated review: best data analyst courses for beginners.
What Actually Gets You Interviews
From my experience reviewing analyst resumes and talking to hiring managers, the gap between ‘I have these skills’ and ‘I get callbacks’ comes down to three things: how you prove your skills, how you frame your experience, and how visible you are.
Skills Recruiters Prioritize First
- SQL — tested in nearly every analyst hiring process
- Excel — still used daily in most analyst roles
- One visualization tool, well — either Power BI or Tableau
- Clear, concise written communication about data
- Demonstrated business understanding, not just technical fluency
Resume Mistakes That Kill Callbacks
- Listing tools as skills without demonstrating projects using them
- Generic objective statements instead of a specific value proposition
- Not quantifying achievements — ‘analyzed data’ vs ‘reduced reporting time by 40% through automated dashboard’
- Including irrelevant experience without connecting it to analytical thinking
LinkedIn Optimization for Aspiring Analysts
- Headline: ‘Aspiring Data Analyst | SQL | Power BI | Excel’ beats ‘Looking for opportunities’
- About section: frame your transition story with specific skills and projects
- Featured section: link to your GitHub portfolio or published dashboards
- Engage with analyst content weekly — recruiters notice active profiles
A Realistic 6-Month Data Analyst Roadmap
This is the exact sequence I recommend to anyone starting the data analyst roadmap for beginners. It is not the fastest possible path — it is the most reliable one.
| Month | Focus | Goal |
| Month 1–2 | Foundation + Excel | Understand business metrics; master VLOOKUP, pivot tables, and dashboard basics |
| Month 2–3 | SQL + Databases | Write JOIN queries, GROUP BY aggregations, and basic CTEs confidently |
| Month 3–4 | Visualization + Dashboards | Build 2 complete dashboards in Power BI or Tableau using real datasets |
| Month 4–5 | Python + Projects | Complete pandas workflows; start first end-to-end portfolio project |
| Month 5–6 | Portfolio + Applications | Finish 3 portfolio projects; optimize resume; apply to 5+ roles weekly |
| Pro Tip |
| Start applying at month 4, not month 6. Early applications build interview skills and reveal real gaps faster than any course. Rejection is data — use it. |
Common Data Analyst Roadmap Mistakes That Waste Months
Tutorial Addiction
Tutorial addiction is the most common trap in the data analyst roadmap github community. It feels productive — you are learning! But watching a tutorial is not the same as solving a problem independently. After any tutorial, close it and reproduce the solution from memory before moving on.
Learning Too Many Tools Simultaneously
I have seen beginners juggling Python, R, Power BI, Tableau, Excel, and SQL at the same time. What I have seen consistently is that this approach produces surface-level knowledge across all tools and mastery of none. Pick two: SQL and one visualization tool. Get good. Then expand.
| Common Mistakes Summary |
| Tutorial addiction: watching without doing |
| Tool overload: learning everything at once |
| Ignoring business context: building dashboards without understanding the problem |
| Weak portfolio projects: generic datasets with no business narrative |
| Waiting too long before applying: most beginners apply 3 months too late |
Beginner vs Advanced Data Analyst Career Paths
| Path | Focus | Key Skills | Typical Transition |
| Generalist Analyst | Business reporting, KPIs | SQL, Excel, Power BI | Entry-level starting point |
| BI Analyst | Dashboards, data modelling | Power BI, DAX, SQL | After 1–2 years |
| Product Analyst | User behaviour, A/B testing | SQL, statistics, Mixpanel | After 1–2 years |
| Analytics Engineer | Data pipelines, dbt, modelling | SQL, dbt, Python | After 2–3 years |
| Data Scientist Transition | ML, modelling, prediction | Python, statistics, ML libraries | After 3+ years |
The Tools Stack Most Modern Data Analysts Use
Core Tools by Category
- Excel / Google Sheets — data manipulation, quick analysis, stakeholder reports
- SQL (PostgreSQL, MySQL, BigQuery) — querying, transformation, data access
- Power BI or Tableau — interactive dashboards and business reporting
- Python (pandas, NumPy, Seaborn) — automation, complex analysis, larger datasets
- dbt — data transformation in the warehouse (analytics engineering path)
- Snowflake / BigQuery / Redshift — cloud data warehouses for enterprise environments
- ChatGPT / Claude — writing SQL, debugging code, drafting analysis narratives
| AI Tools Analysts Are Starting to Use |
| AI coding assistants (GitHub Copilot, Claude) — autocomplete SQL and Python |
| AI for report writing — drafting executive summaries from analysis results |
| AI for data cleaning — identifying outliers and suggesting cleaning steps |
| No-code AI dashboards — tools like Thoughtspot for natural language querying |
Quick Checklist: Are You Job Ready Yet?
Technical Skills Checklist
- Can write JOIN queries with GROUP BY and window functions in SQL
- Can build a pivot table and connected dashboard in Excel
- Can build an interactive dashboard in Power BI or Tableau
- Can manipulate a dataframe in Python using pandas
- Can explain mean, median, standard deviation, and correlation to a non-technical person
Portfolio Checklist
- 3 completed projects with business questions and recommendations
- Each project has a clear README written for non-technical readers
- GitHub profile has consistent naming and organized repositories
- At least one published dashboard (Tableau Public or Power BI Service)
Resume Checklist
- Technical skills section includes SQL, Excel, Power BI or Tableau, Python
- Project bullets include quantified outcomes, not just tasks
- Resume is one page, clear, and ATS-friendly
- LinkedIn profile links to portfolio GitHub
Frequently Asked Questions
Can I Become a Data Analyst Without a Degree?
Yes, absolutely. From my experience, a strong portfolio of projects demonstrates your capabilities far more convincingly than a degree in a different field. Many successful analysts come from business, finance, humanities, or self-taught backgrounds. What matters is your ability to answer business questions with data.
How Long Does It Take to Become Job-Ready?
With consistent daily effort (1.5 to 2 hours per day), most beginners can reach job-ready status in 5 to 8 months. The wide range depends on how quickly you move from learning to building projects. Beginners who build portfolio projects while learning are typically hired 2 to 3 months faster than those who complete every course before starting projects.
Is Python Mandatory for Data Analysts?
Python is not mandatory for most entry-level analyst roles, but it is a strong differentiator. In 2026, the majority of analyst job postings list Python as preferred, not required. Start with SQL and Excel. Add Python once those are solid. Do not delay your job search waiting for Python mastery.
Should I Learn Excel or SQL First?
Learn Excel first, then SQL. Excel teaches data thinking in a visual, intuitive environment. It builds the mental models (filtering, grouping, aggregating) that make SQL easier to understand. Most analysts also need both skills daily, so learn them in sequence rather than choosing one over the other.
Do Certifications Really Help?
Certifications help in two specific situations: when you have zero prior experience and need something on a resume, and when they are from recognized providers like Google or Microsoft. They do not replace portfolio projects. A certificate without projects is a much weaker signal than projects without a certificate.
Can I Become a Data Analyst Without Coding?
You can start your career with minimal coding using Excel and Power BI or Tableau. Some analyst roles, particularly in non-technical industries, rarely require Python. However, SQL is unavoidable — it is the baseline skill for 85% of analyst roles and is generally considered essential, not optional.
What Projects Should Beginners Build First?
Start with a sales or e-commerce dataset and build one Excel dashboard, one SQL analysis, and one Power BI or Tableau dashboard. These three projects cover your core tools and give you portfolio material before you have finished learning Python. Complexity comes later. Clarity and completeness matter first.
Final Action Plan: What to Learn Next Starting Today
You have read the complete data analyst roadmap. Now the only thing that matters is what you do in the next 30 days. Here is the exact action plan I give to every beginner I work with.
The Exact First 30 Days Plan
- Days 1–3: Set up your tools — install Excel, sign up for SQL practice (Mode or SQLZoo), create a GitHub account
- Days 4–10: Complete a structured Excel skills module — focus on VLOOKUP, pivot tables, and a simple dashboard
- Days 11–20: Start SQL with SELECT, WHERE, GROUP BY, and JOINs — use a free platform with real database tables
- Days 21–25: Find a public dataset (Kaggle, data.gov, or Google Dataset Search) and perform your first complete analysis
- Days 26–30: Write up your analysis as a GitHub repository with a clear README and push it live
How to Avoid Burnout While Learning
- Learn in short focused sessions (60 to 90 minutes) rather than 4-hour marathon sessions
- Alternate between learning and building — never spend more than 5 consecutive days on courses alone
- Join a community — analyst Discord servers, LinkedIn groups, or Reddit (r/dataanalysis) provide accountability
- Celebrate small wins — every completed SQL query, every saved dashboard, every published GitHub commit
| Your First Move Right Now |
| If you are ready to start the data analyst roadmap today, the single most important first step is choosing a structured learning path. |
| I have reviewed the best beginner-friendly courses so you do not have to search randomly. |
Start here: Best Data Analyst Courses for Beginners (Reviewed) — my curated breakdown of which courses are actually worth your time and money in 2026.