| WHY YOU CAN TRUST THIS GUIDE |
| I have spent several years working directly with enterprise analytics teams, evaluating BI platforms, and helping professionals break into data careers. |
| Every recommendation here comes from hands-on experience — not vendor marketing pages or generic listicles. |
| I have reviewed Oracle BI deployments, cloud analytics migrations, and certification paths across finance, retail, and logistics industries. What you read below reflects what actually works in practice. |
Introduction
Here is a frustrating reality I have seen repeatedly across organizations: companies are collecting more data than ever before — and making worse decisions because of it.
The dashboards multiply. The spreadsheets pile up. Executives receive weekly reports that nobody reads. And somewhere in all of that noise, the actual insight that would drive a better outcome gets completely buried.
Business intelligence & analytics has become one of the most talked-about disciplines in enterprise technology — and one of the most misunderstood. In this guide, I am going to break down exactly what business intelligence & analytics means in 2026, how Oracle analytics fits into the picture, and what it actually takes to build analytics systems that drive real decisions.
Why Businesses Still Struggle With Data in 2026
From my experience working with analytics teams, the struggle is almost never about having enough data. It is about three persistent problems:
- The growing gap between data collection and actual decision-making
- Traditional reporting systems built for compliance, not action
- Leadership expecting instant insights but receiving delayed, static reports
Modern enterprises expect real-time visibility, predictive intelligence, and self-service capabilities — not quarterly reports that land in a PDF nobody opens. Traditional reporting no longer meets these expectations.
Quick Answer: What Business Intelligence & Analytics Really Mean
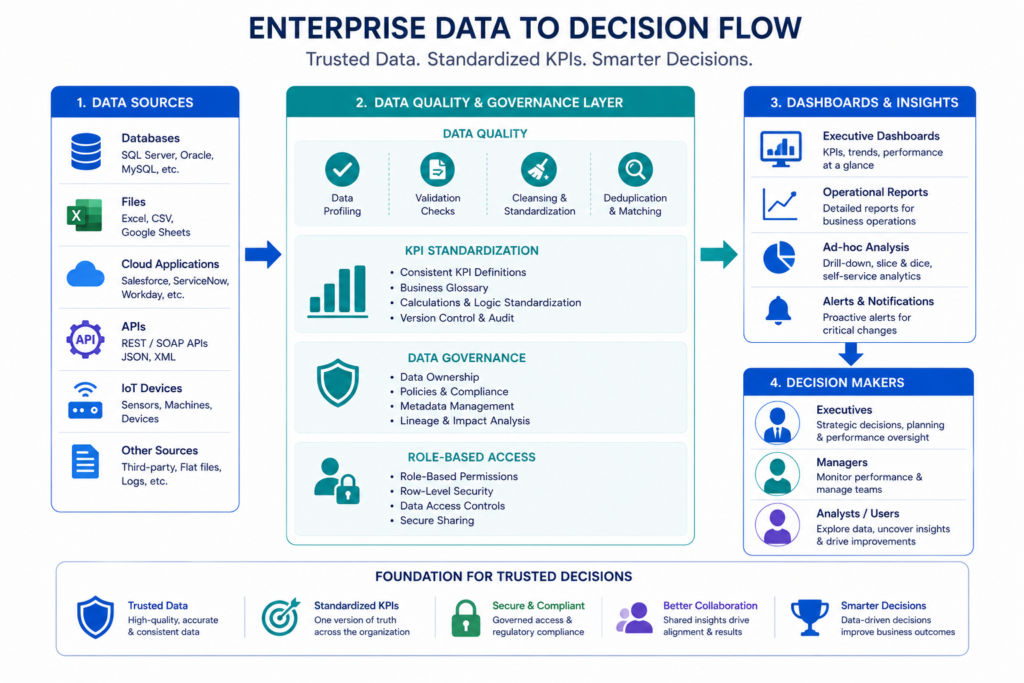
Business intelligence & analytics is the practice of collecting, organizing, analyzing, and visualizing business data to support faster and better decisions.
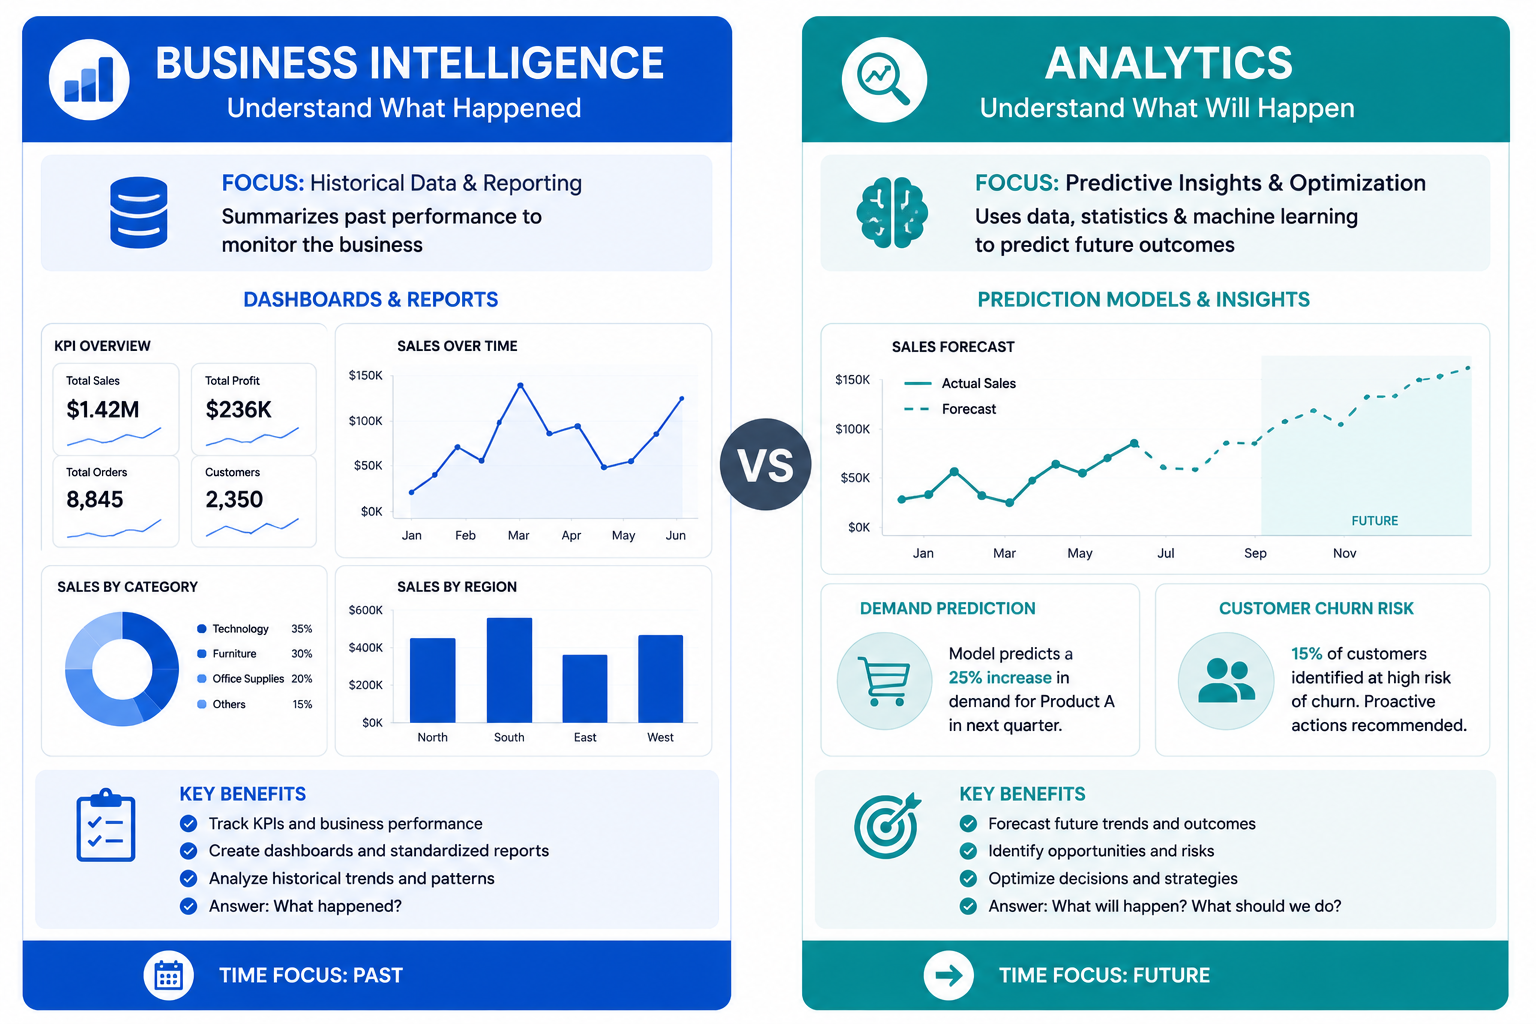
In practical terms, BI refers to the infrastructure and reporting layer — the dashboards, data warehouses, and structured queries that show organizations what has happened. Analytics goes further and asks why it happened — and what is likely to happen next.
Oracle analytics platforms sit at the intersection of both. They provide the reporting backbone that enterprises rely on while offering cloud-native analytical capabilities for predictive and prescriptive use cases.
| KEY TAKEAWAY |
| BI tells you what happened. Analytics tells you why — and what to do about it. |
| The most effective enterprise systems combine both layers into a unified decision-support platform. |
What Actually Makes Business Intelligence Valuable
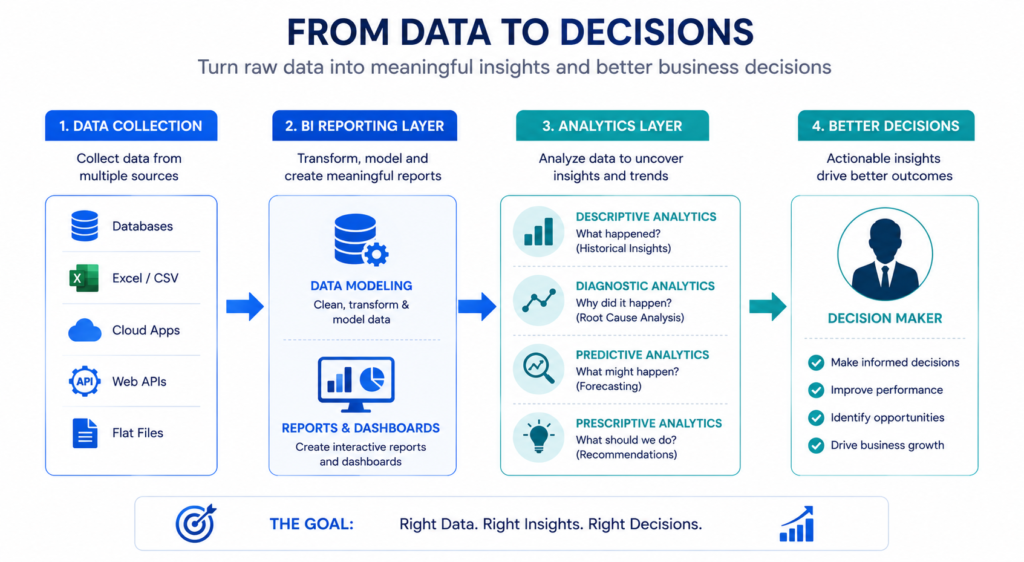
Moving From Raw Data to Actionable Decisions
The phrase ‘data-driven decision making’ has lost much of its meaning. What I have actually seen is this: most companies are data-rich and insight-poor. The transformation from raw operational data to actionable insight requires more than a visualization tool.
- Data integration from multiple source systems into a reliable warehouse
- Business-logic-driven transformations that create meaningful metrics
- Contextual visualization that connects numbers to real decisions
- Real-time analytics pipelines for time-sensitive operational data
Visualization alone is never enough. I have seen organizations spend six figures on Tableau licenses and still make decisions based on gut feeling — because the underlying data was never validated. The tool is the last step, not the first.
The Difference Between Business Intelligence and Analytics

| Dimension | BI vs Analytics Comparison |
| Focus | BI: What happened | Analytics: Why it happened and what will happen next |
| Output | BI: Dashboards and reports | Analytics: Predictions, models, recommendations |
| Timeframe | BI: Historical reporting | Analytics: Historical + predictive + prescriptive |
| Users | BI: Executives and managers | Analytics: Data scientists and analysts |
| Tools | BI: Oracle BI, Power BI, Tableau | Analytics: Oracle Analytics Cloud, Python, R |
| Business Value | BI: Operational visibility | Analytics: Strategic competitive advantage |
The Biggest BI Misconceptions That Hurt Companies
| COMMON MISTAKES TO AVOID |
| Dashboard overload: Building 50 dashboards instead of 5 trusted ones destroys team adoption. |
| Poor data quality: No amount of visualization fixes dirty source data. |
| Tool obsession: Buying the most expensive platform does not guarantee better business decisions. |
| Vanity metrics: Tracking what is easy to measure instead of what actually drives the business. |
How Modern Enterprises Use Business Intelligence & Analytics
Real Business Intelligence Applications That Deliver Results
From my experience advising enterprise analytics projects, the highest-ROI use cases consistently fall into four categories:
- Sales performance optimization — tracking pipeline health, conversion rates, and rep performance against real-time targets
- Supply chain and inventory forecasting — using historical demand data to reduce overstock and stockout events
- Financial analytics and executive reporting — connecting P&L performance to operational drivers
- Customer behavior analysis — building cohort models that predict churn and identify upsell opportunities
| CASE STUDY |
| A regional logistics firm I worked with had 14 separate dashboards tracking the same delivery KPIs — each using slightly different definitions. |
| The result was constant disagreement in leadership meetings about basic performance numbers. |
| After consolidating to a single Oracle BI source of truth with standardized KPI definitions, decision cycle time dropped from days to hours. |
| Lesson: Governance and standardization deliver more value than any new analytics feature. |
Oracle Business Intelligence Applications Explained
Oracle business intelligence applications are a suite of pre-built analytics solutions designed for enterprise-scale reporting across industries including finance, HR, supply chain, and customer experience.
What distinguishes oracle business intelligence applications from generic BI tools:
- Pre-built data models aligned to Oracle ERP and CRM data structures
- Industry-specific KPI libraries for finance, HR, procurement, and operations
- Deep integration with Oracle Fusion, E-Business Suite, and cloud ecosystems
- Enterprise-grade security with role-based data access controls
Large enterprises continue relying on oracle business intelligence because migrating decades of embedded reporting logic is a significant undertaking. For organizations running Oracle ERP, these applications deliver immediate value with minimal integration overhead.
If you are exploring BI career paths, my guide on becoming a business intelligence developer covers the skills and progression you actually need.
What Actually Works in Enterprise Analytics Projects
| PRO TIP |
| Three things consistently separate successful BI projects from failed ones: |
| 1. Trustworthy data pipelines with automated quality checks |
| 2. KPIs tied to actual business decisions — not vanity metrics |
| 3. A governance model everyone agrees on before the first dashboard is built |
- Build trustworthy data pipelines — automate quality checks and document transformation logic
- Align KPIs with business goals — every metric should connect to a decision someone makes
- Establish governance policies before building dashboards, not after
- Create cross-department analytics collaboration to break data silos
Oracle Business Intelligence and Cloud Analytics Ecosystem
Understanding Oracle Business Intelligence Platforms
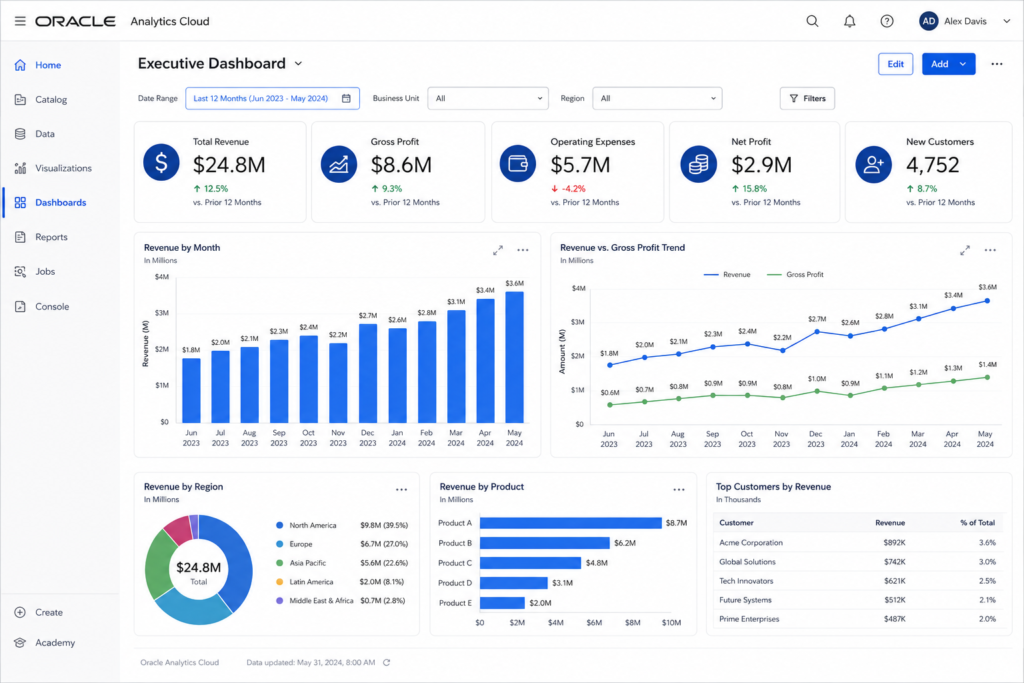
Oracle’s analytics ecosystem spans two major architectural layers. The first is Oracle BI Enterprise Edition (OBIEE) — the backbone of reporting for thousands of large organizations. The second is Oracle Analytics Cloud, which extends those capabilities into a modern, cloud-native environment.
Core Oracle BI capabilities:
- Semantic layer modeling for consistent business logic across all reports
- Pixel-perfect reporting for regulatory and financial document generation
- Interactive dashboards with drill-down and guided navigation
- Enterprise-scale architecture supporting thousands of concurrent users
Oracle Analytics Cloud Training: Skills That Matter
Oracle analytics cloud training is one of the most direct paths to enterprise analytics roles. The candidates who get hired fastest are not necessarily the ones with the longest certification list — they are the ones who understand how BI connects to business decisions.
Core skills beginners should learn first in oracle analytics cloud training:
- Data modeling fundamentals — understanding dimensions, facts, and hierarchies
- Building and publishing visualizations in Oracle Analytics Cloud
- Connecting to Oracle and non-Oracle data sources
- Cloud-based analytics workflows for automated refresh and scheduling
- Basic security and governance — row-level security and data access policies
If you are just starting out, check my guide on data analyst courses for beginners before diving into Oracle-specific platform training.
Beginner vs Advanced Oracle Analytics Users
| User Level | Focus Areas and Responsibilities |
| Beginner | Dashboard creation, basic data connections, standard reports, visualization best practices |
| Intermediate | Data modeling, calculated metrics, scheduled reports, user access management |
| Advanced / Enterprise | Semantic layer customization, large-scale deployments, performance tuning, multi-source federation |
| Analytics Engineer | Automated pipelines, ML model integration, governance architecture, cloud infrastructure |
Business Intelligence Tools That Dominate in 2026
What Companies Actually Use Today
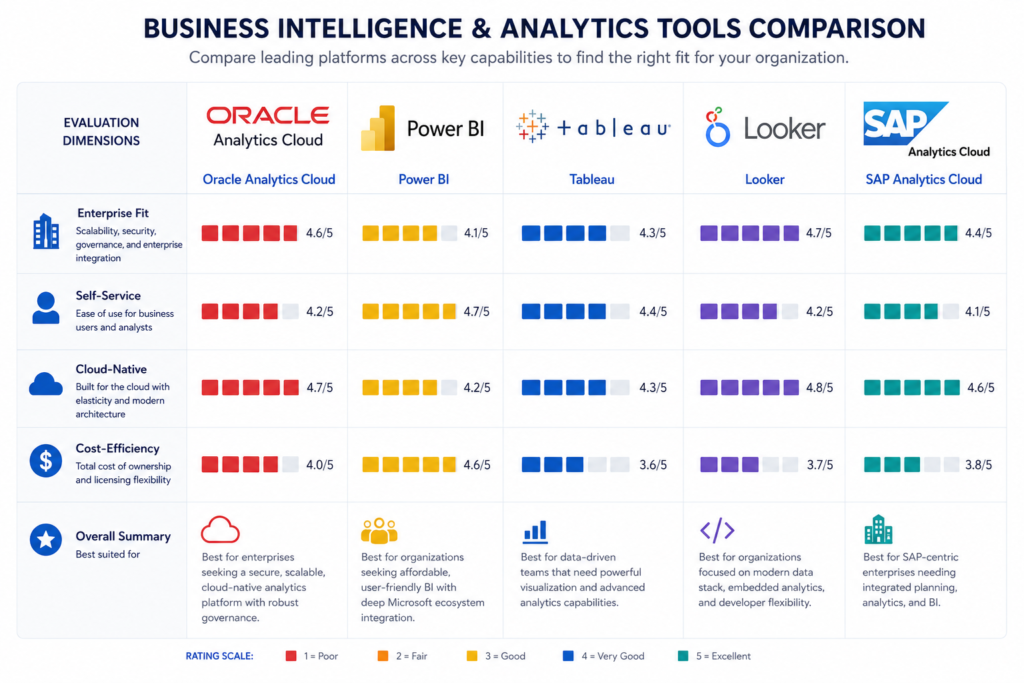
| Platform | Best For and Key Strengths |
| Oracle Analytics Cloud | Enterprise Oracle environments, semantic layer modeling, cloud-native BI, large-scale deployments |
| Power BI | Microsoft ecosystem, SMBs and mid-market, fast prototyping, Excel integration |
| Tableau | Visual analytics, self-service exploration, Salesforce-integrated organizations |
| Looker | Data-as-code approach, engineering-driven teams, Google Cloud environments |
| SAP Analytics Cloud | SAP ERP users, financial planning, enterprise budgeting and forecasting |
For a deeper breakdown, I have covered the full landscape in my data analytics tools comparison guide — including which platforms are worth learning for career growth.
Choosing the Right Analytics Platform
Most companies evaluate tools based on demos and analyst rankings instead of asking the right questions about their own environment.
- Small business vs enterprise: Power BI and Looker for smaller teams; Oracle and SAP for large organizations with complex ERP landscapes
- Cloud-native vs on-premise: If you are modernizing, go cloud-first unless regulatory requirements force otherwise
- Scalability: How many concurrent users and data sources? These questions matter more than feature lists
- Cost vs business value: The tool your team actually uses beats the most powerful tool they will not
Common Tool Selection Mistakes
| MISTAKES THAT COST ORGANIZATIONS TIME AND MONEY |
| Choosing based on popularity alone — the best tool fits your data architecture and team skills, not Gartner rankings. |
| Ignoring integration requirements — a beautiful dashboard that cannot connect to your core systems delivers zero value. |
| Underestimating governance needs — without a governance model, self-service analytics creates more chaos than clarity. |
The Practical Framework for Building a Successful BI Strategy
Step 1: Define Business Problems First
Every failed BI project I have reviewed had the same root cause: they started with the tool, not the problem. The analytics architecture should always follow from business questions.
Questions leadership must answer before any data work begins:
- What decisions are we currently making slowly or incorrectly because we lack the right data?
- Which KPIs, if improved, would directly impact revenue, cost, or customer satisfaction?
- Who are the actual decision-makers who will use these reports?
Step 2: Build Reliable Data Foundations
The most sophisticated analytics platform cannot save you from bad data. Organizations with the best analytics are not the ones with the most tools — they are the ones who invested in data quality first.
- Data warehousing fundamentals: Build a centralized, governed layer before you build dashboards
- Data quality validation: Automate checks for completeness, consistency, and freshness
- Governance best practices: Agree on KPI definitions across departments before a single report is created
Step 3: Create Decision-Focused Dashboards
Here is what actually works: fewer dashboards, each with a clear decision-making purpose. Every metric should answer a question that leads to an action.
- Tie every visualization to a specific business question
- If a chart does not change behavior, remove it
- Executive reporting: high-level KPIs with drill-down capability, not tables of raw data
| PRO TIP |
| If you cannot explain what decision each dashboard widget is designed to support, that widget should not exist. |
| The best dashboards I have seen contain fewer than 10 metrics — and every single one connects to a business action. |
Step 4: Enable Self-Service Analytics
Self-service analytics is one of the most powerful — and most frequently misimplemented — BI capabilities. Giving everyone access to raw data without governance creates confusion, not clarity.
- Help teams explore data independently through guided templates and curated datasets
- Balance flexibility with governance: self-service within guardrails beats either extreme
For a full analytics career progression, my data analyst roadmap for career growth walks through the path from junior analyst to senior roles.
Business Intelligence Careers and Future Opportunities
Why BI & Analytics Skills Are Growing Fast
Demand for analytics professionals is not just growing — it is accelerating. Enterprise cloud transformation has created a massive need for people who understand both the technical and business sides of data. AI-powered analytics is adding entirely new skill requirements on top of that.
- Organizations migrating from on-premise BI to cloud-native platforms at scale
- Every major enterprise software suite now has embedded analytics requiring human expertise
- AI-generated insights still require human oversight and business context — creating hybrid roles
The Most Valuable BI Skills in 2026
| Skill | Why It Matters in 2026 |
| SQL and data modeling | Still the foundation of every analytics role — non-negotiable baseline |
| Dashboard development | The visible output of BI work — required in virtually every BI job description |
| Cloud analytics platforms | Oracle Analytics Cloud, Power BI, Tableau — cloud fluency is a baseline requirement |
| Data engineering fundamentals | Understanding pipelines separates junior from senior analysts |
| Business communication | Translating technical findings into executive decisions — the highest-leverage skill |
Career Paths in Business Intelligence
- BI Developer — builds and maintains reporting infrastructure, dashboards, and semantic layers
- Analytics Engineer — bridges data engineering and analytics, builds transformation pipelines
- Data Analyst — interprets data, generates insights, communicates findings to business stakeholders
- Data Engineer — builds and maintains data pipelines and warehousing infrastructure
- Cloud Analytics Consultant — advises on platform selection, migration, and governance
I have a full breakdown of credentials in my data analyst certifications guide — including which certifications employers actually value.
Mistakes That Kill Business Intelligence Projects
Technology Without Strategy
This is the most expensive mistake in the analytics world. Organizations buy enterprise BI platforms before defining what questions they need to answer. The result is beautiful dashboards that nobody trusts — because the data behind them was never validated or connected to actual business decisions.
The ROI conversation focuses on platform cost, not the organizational change management required to actually use the data. A dashboard nobody opens earns zero return.
Poor Data Governance
| GOVERNANCE FAILURES THAT DERAIL BI PROJECTS |
| Inconsistent KPI definitions: Sales and Finance both report revenue, but calculate it differently — creating constant disagreement. |
| Duplicate reporting systems: When every department builds their own reports from separate data extracts, there is no single source of truth. |
| No ownership model: Without clear ownership of data quality and KPI definitions, governance deteriorates over time. |
Ignoring User Adoption
Analytics systems succeed only when people actually use them. Adoption almost always comes down to two factors: trust in the data and ease of use.
- If dashboard numbers are ever wrong — even once — trust takes months to rebuild
- Every new BI tool requires investment in ongoing user education, not just launch-day training
What the Future of Business Intelligence & Analytics Looks Like
AI-Augmented Analytics
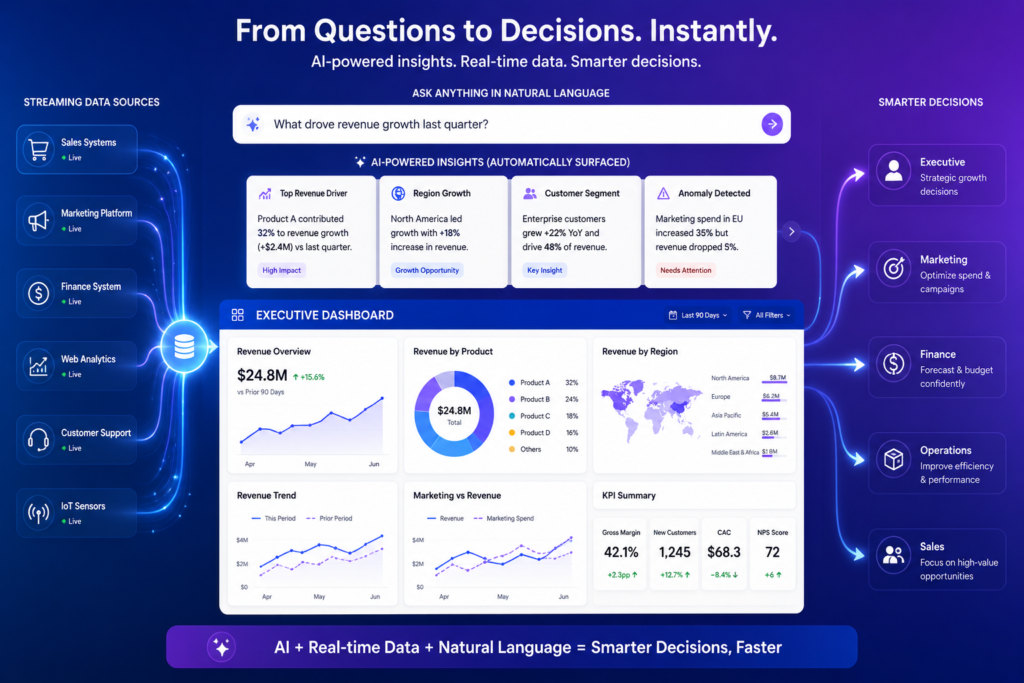
The shift from human-driven analytics to AI-augmented decision support is happening right now. Three capabilities are reshaping what business intelligence & analytics means in practice:
- Natural language querying — asking questions in plain English and receiving visualizations automatically
- Predictive analytics automation — ML models embedded directly in BI platforms without requiring a data science team
- AI-generated insights — the platform surfaces anomalies and trends before a human analyst identifies them
Real-Time Decision Intelligence
Batch reporting that runs overnight is becoming obsolete in industries where decisions happen in minutes. The growth of streaming analytics is creating entirely new architectural requirements for BI teams.
- Streaming analytics: real-time data pipelines replacing nightly ETL batch processes
- Operational intelligence platforms: BI embedded directly in operational workflows, not just management dashboards
Cloud-Native Analytics Transformation
The migration to cloud analytics is no longer a question of whether — only of pace. Oracle Analytics Cloud is increasingly the primary deployment target for new oracle business intelligence implementations.
- Enterprises moving to cloud benefit from automatic upgrades, elastic scalability, and reduced infrastructure overhead
- Oracle’s cloud roadmap combines BI reporting, augmented analytics, and ML model deployment in a unified platform
For the Microsoft ecosystem, my guide on Power BI courses for beginners covers the fastest path to cloud analytics proficiency on that platform.
Practical Checklist for Building Better Analytics Systems
| ENTERPRISE BI CHECKLIST |
| 1. Define measurable business goals — every analytics initiative needs a clear business question it answers |
| 2. Standardize KPIs — agree on definitions across all departments before building any reports |
| 3. Validate data quality — audit source systems before connecting them to BI platforms |
| 4. Train business users — platform adoption requires ongoing education, not just launch-day onboarding |
| 5. Monitor dashboard adoption — track who uses which reports and remove what nobody opens |
| 6. Establish governance policies — assign data owners, review KPI definitions quarterly, document changes |
Frequently Asked Questions
Is business intelligence different from data analytics?
Yes, though they overlap significantly. Business intelligence focuses on structured reporting of historical data to support operational decisions. Data analytics is broader — including statistical analysis, predictive modeling, and data science. Modern BI platforms increasingly incorporate analytics capabilities, which is why the combined term ‘business intelligence & analytics’ is now widely used.
What are Oracle business intelligence applications used for?
Oracle business intelligence applications are pre-built analytics solutions for enterprise functions including finance, human resources, supply chain, and procurement. They provide industry-specific KPIs, pre-configured data models aligned to Oracle ERP systems, and reporting templates that significantly reduce implementation time compared to building analytics from scratch.
Is Oracle Analytics Cloud good for beginners?
Oracle Analytics Cloud has an accessible visual interface for basic dashboard creation. To unlock enterprise capabilities — semantic layer modeling, data pipeline configuration, and security setup — structured oracle analytics cloud training is recommended. Most beginners with a foundational data background can reach functional proficiency within four to eight weeks.
Which industries use BI & analytics the most?
Financial services, healthcare, retail, manufacturing, and telecommunications are the heaviest adopters. These industries generate high volumes of transactional data and operate in environments where decision speed and accuracy directly impact revenue and regulatory compliance outcomes.
What skills are required for business intelligence careers?
The core skills are SQL and data modeling, dashboard development on platforms like Oracle Analytics Cloud or Power BI, data pipeline fundamentals, and business communication. Cloud platform proficiency is now required at all levels, and data governance knowledge is highly valued in senior roles.
How long does it take to learn Oracle analytics tools?
For basic dashboard creation and reporting, most learners reach functional proficiency in four to eight weeks with structured oracle analytics cloud training. Building expertise in semantic layer configuration and enterprise deployment typically requires three to six months of consistent hands-on practice.
Final Action Plan
Where Beginners Should Start
If you are new to business intelligence & analytics, resist the temptation to jump straight into platform training. Start with fundamentals:
- Build a working understanding of data modeling — dimensions, facts, and how business metrics are constructed
- Learn SQL to a functional level — it remains the universal language of data across every platform
- Practice basic visualization and reporting in any modern BI tool
- Study real business use cases to understand how analytics supports actual decisions
My data analyst courses for beginners guide is the right starting point before moving into Oracle-specific training.
What Professionals Should Focus on Next
If you already have analytics experience, the highest-leverage investments in 2026 are:
- Cloud analytics — become proficient in at least one major cloud BI platform; Oracle Analytics Cloud is an excellent choice for enterprise environments
- Data engineering integration — understanding how pipelines work makes you dramatically more effective as an analytics professional
- Advanced analytics architecture — learn how to design governed, scalable BI systems, not just individual dashboards
The Most Important Takeaway
| THE BOTTOM LINE |
| Business intelligence & analytics succeeds when it improves decisions — not just dashboards. |
| Every technology choice, every data pipeline, every visualization should trace back to a business question that someone needs to answer faster and more accurately. |
| The organizations that win with data are not the ones with the most tools. They are the ones who combine trustworthy data, clear governance, and analytics capabilities aligned to the decisions that actually matter. |
| If you want to build those capabilities — for your organization or your career — start with the problem. The platform will follow. |
| READY TO START? YOUR NEXT STEP |
| Building toward a BI career? Explore my data analyst certifications guide for credentials employers value in 2026. |
| Evaluating tools? My data analytics tools comparison matches the right platform to your environment and team size. |
| Leading an enterprise BI initiative? Start with Step 1 of the framework above — define the business problem before any technology decision. |
| New to analytics? Begin with my data analyst courses for beginners and build the foundation that makes everything else faster. |